
Watch These Qualcomm Price Levels as Stock Drops on Soft Outlook

Key Takeaways
Qualcomm (
QCOM
) shares tumbled Thursday morning after the mobile chip designer
issued a light revenue outlook
that overshadowed better-than-expected quarterly results.
While the company said it doesn’t currently anticipate any material impact from tariffs, and that it had not seen elevated pre-emptive product purchasing ahead of possible import duties during the quarter, it cautioned the situation could change due to unpredictable
U.S.-China trade tensions
.
Qualcomm’s shares were down 8% at around $136 in recent trading. The stock has lost about 17% of its value over the past 12 months, due in part to concerns that the company could see a significant decline in
revenue
as key customer Apple (
AAPL
) ramps up production of in-house chips to power its devices.
Below, we break down the
technicals
on Qualcomm’s chart and identify major price levels investors may be watching.
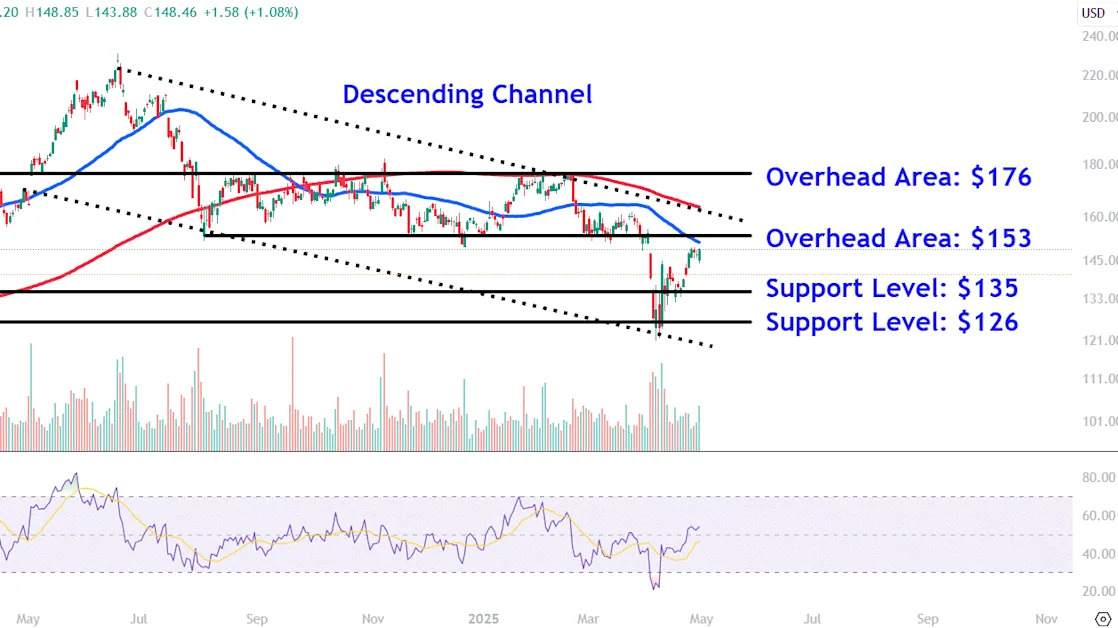
Multi-Month Descending Channel
Qualcomm shares had been entrenched in a multi-month
descending channel
since setting their
record high
last June.
More recently, the stock rallied from the pattern’s lower trendline, which coincided with the
relative strength index (RSI)
crossing back above the 50 threshold to signal accelerating price momentum.
However, the buying enthusiasm ended abruptly Thursday, potentially paving the way for the stock to resume its longer-term
downtrend
.
Let’s point out two major price levels on Qualcomm’s chart where the shares could encounter
support
, while also identifying important overhead areas that could come into play during potential upswings.
Major Support Levels to Watch
Investors should initially keep tabs of the $135 level. The shares may find support in this area near the mid-April dip and the low of a
retracement
that formed on the chart early last year during an extended
uptrend
.
A more significant drop could see the shares revisit lower support around $126. Investors may seek
entry points
in this location near trading activity positioned just above last month’s low, which also closely aligns with the bottom range of a
consolidation
period in late 2023.
Key Overhead Areas to Monitor
Future upswings in the stock could lead to a test of overhead
resistance
at $153. This area on the chart, currently just above the popular
50-day moving average
, may provide selling pressure near a trendline that connects a range of troughs stretching from August to March.
Finally, a
breakout
above this technically significant level could fuel a move to the $176 area. Investors may look to offload Qualcomm shares in this region near a
horizontal line
that links a string of closely aligned peaks on the chart stretching back to March last year.
The comments, opinions, and analyses expressed on Investopedia are for informational purposes only. Read our
warranty and liability disclaimer
for more info.
As of the date this article was written, the author does not own any of the above securities.
Read the original article on
Investopedia
