
Watch These Supermicro Price Levels as Stock Plunges After Weak Results

Key Takeaways
Super Micro Computer (
SMCI
) shares plummeted in extended trading on Tuesday after the server maker
posted preliminary results
for its fiscal third quarter that came in well below its prior guidance.
The company tied the downward revision to delayed consumer product decisions that pushed sales into the current quarter, amplifying broader concerns of a slowdown in spending amid
uncertainty over the Trump administration’s sweeping tariffs
.
Supermicro shares fell 15% to $30.60 in after-hours trading Tuesday.
Prior to today’s after-hours drop, Supermicro shares had gained 18% so far this year. The stock has, however, seen significant price swings as investors assess recent challenges relating to the company’s
accounting
and corporate governance practices amid a clouded demand outlook for AI infrastructure, such as servers used in data centers.
Below, we take a closer look at Supermicro’s chart and use
technical analysis
to identify crucial price levels worth monitoring.
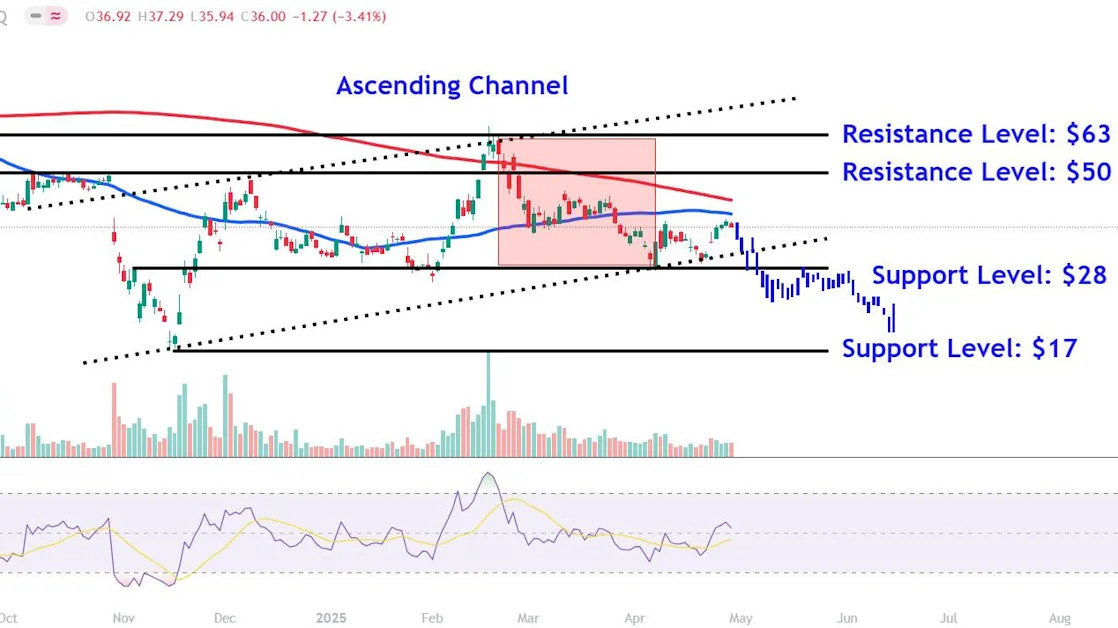
Ascending Channel in Play
Supermicro shares have oscillated within an
ascending channel
since October last year, tagging the pattern’s upper and lower trendlines on several occasion over that time.
More recently, the stock has rallied from the channel’s lower trendline, though the price has remained below the respected 50- and
200-day moving averages
to indicate a longer-term
downtrend
.
With Wednesday’s projected drop back toward the ascending channel’s lower trendline, let’s identify two crucial
support levels
worth monitoring and also point out
resistance
levels to watch during potential upswings.
Support Levels Worth Monitoring
The first support level to monitor sits at $28. This area on the chart, just below the ascending channel’s lower trendline, may attract buying interest near the April and February
swing lows
, which also closely align with a minor
countertrend
high during the stock’s sharp sell-off in early November last year.
The bulls’ inability to successfully defend this important technical level opens the door for a larger decline to around $17. Bargain hunters may seek
entry points
in this area near November’s prominent V-shaped
swing low
. Interestingly, this location also sits just below a projected
downside
target that takes the stock’s prior move lower within the ascending channel and repositions it from this week’s high, predicting how a new trend lower may look if
price action
rhymes.
Resistance Levels to Watch
During upswings, the first level of interest to watch lies at the
psychological
$50 level. Those who bought shares at lower prices may decide to
lock in profits
in this region near last year’s early-August trough and the upper range of a consolidation period that formed on the chart last October.
Finally, a more bullish move could see Supermicro shares revisit higher levels near $63. This area on the chart would likely provide resistance near a
horizontal line
that connects notable
swing highs
in August last year and February this year.
The comments, opinions, and analyses expressed on Investopedia are for informational purposes only. Read our
warranty and liability disclaimer
for more info.
As of the date this article was written, the author does not own any of the above securities.
Read the original article on
Investopedia
