
Watch These Apple Stock Price Levels Ahead of This Week’s Earnings Report

Key Takeaways
Apple (
AAPL
) shares will be in the spotlight ahead of the iPhone maker’s highly anticipated fiscal second-quarter results, due after Thursday’s closing bell.
Wall Street will be paying close attention to the tech giant’s guidance for the current quarter in an effort to determine what
impact tariffs and potential price increases
have had on consumer demand for the company’s devices.
Investors will also be looking for updates on recent reports that Apple intends to produce most of its U.S.-sold iPhones in India by the end of 2026. The company is aiming to mitigate risks related to the Trump administration’s steep import duties imposed on China, a country where Apple reportedly assembles up to 90% of its iPhones.
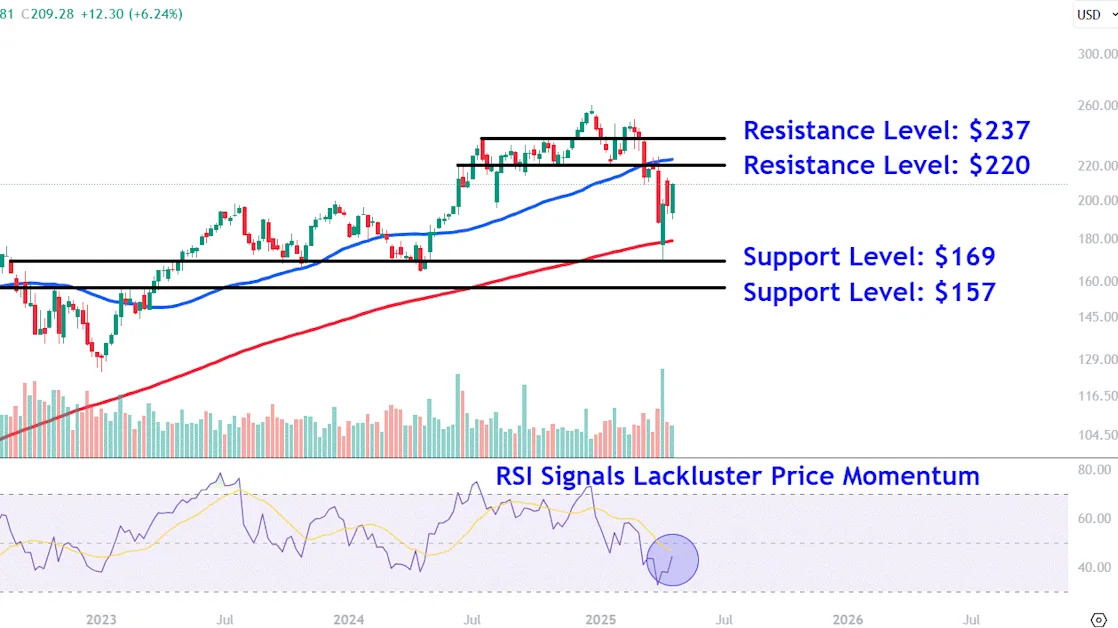
Apple shares trade 16% lower year to date as of Friday’s close but have recovered nearly 25% from this month’s low as investors assess the company’s plans to navigate tariff-related challenges.
Below, we break down the
technicals
on Apple’s
weekly chart
and identify key price levels worth watching ahead of the tech giant’s earnings report.
Lackluster Price Momentum Ahead of Earnings
After staging a dramatic intraday
reversal
at the 200-week moving average (MA) on above-average
volume
earlier this month, Apple shares have continued to gain ground.
However, while the
relative strength index (RSI)
has moved upwards ahead, the indicator remains just below the 50 threshold, signaling lackluster price momentum.
Let’s point out key
support and resistance
levels on Apple’s chart that investors will likely be monitoring.
Key Support Levels to Monitor
The first area to monitor sits around $169. Retracements to this level on the chart would likely attract strong buying interest near this month’s low, which also closely aligns with the August 2022
peak and troughs
in October 2023 and April 2024.
The
bulls
’ failure to defend this key technical level opens the door for a drop to lower support at $157. Investors could seek
entry points
in this region near a
horizontal line
that connects several peaks and troughs on the chart between September 2021 and March 2023.
Crucial Resistance Levels to Watch
In the event of a rally, it’s worth keeping an eye on the $220 level, an area currently just below the 50-week MA. The shares could run into selling pressure in this location near
price action
on the chart extending back to June last year.
Finally, further buying could see Apple’s stock revisit the $237 area. Investors who have
accumulated shares
at lower prices may seek
profit-taking
opportunities in this region near last year’s July and October peaks.
The comments, opinions, and analyses expressed on Investopedia are for informational purposes only. Read our
warranty and liability disclaimer
for more info.
As of the date this article was written, the author does not own any of the above securities.
Read the original article on
Investopedia
