
Watch These Alphabet Price Levels as Stock Rises After Strong Earnings Report

Key Takeaways
Alphabet (
GOOGL
) shares rose Friday after the Google parent posted quarterly results that
topped Wall Street expectations amid AI-fueled search advertising growth
.
The tech giant, which also raised its quarterly dividend and upped its stock
buyback program
, said AI integration into Google search had helped power ad growth, adding that features like AI Overview has driven user engagement. Alphabet reiterated its plans to spend
$75 billion
in capital expenditures this year, most of which is expected to go toward building out the company’s AI infrastructure.
Alphabet shares were up 1.8% at around $162 in late trading, as several analysts raised their price targets for the stock after the strong earnings report. Despite gains over the past week, the stock is 15% lower since the start of the year, due in part to worries over whether the company’s significant investment in AI infrastructure will pay off.
Below, we analyze the
technicals
on Alphabet’s chart and identify crucial price levels that investors will likely be watching.
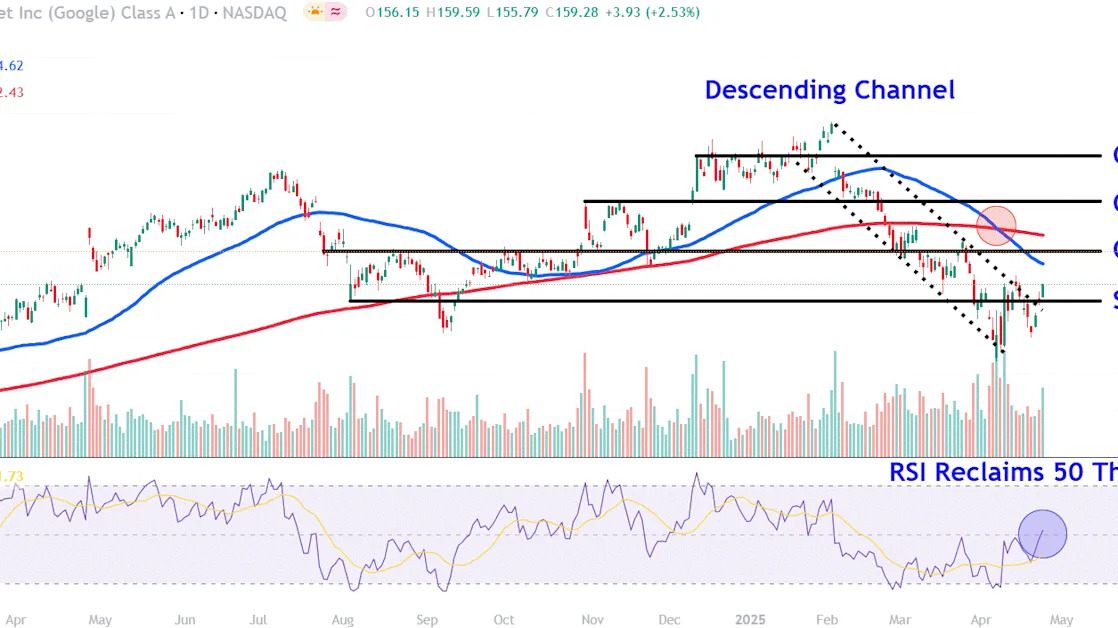
Descending Channel Breakout
Alphabet shares have trended lower within a
descending channel
throughout most of this year, with the
50-day moving average (MA)
recently crossing below the 200-day MA to form an ominous
death cross
, a chart pattern that signal lower prices.
However, the stock staged a
breakout
above the pattern’s upper trendline in Thursday’s trading session, which set the stage for today’s post-earnings gain.
Meanwhile, the
relative strength index (RSI)
flashes a neutral reading, but remains well below
overbought
levels, providing ample room for further upside.
Let’s identify three crucial overhead areas on Alphabet’s chart where the shares may encounter overhead selling pressure and also locate a critical
support level
worth watching during possible retracements.
Crucial Overhead Areas to Monitor
The first area to monitor sits at $168. This location on the chart may provide overhead
resistance
near a trendline that links multiple
peaks and troughs
on the chart extending back to late July last year.
Buying above this level could see the price climb to around $182. Alphabet shares may run into sellers in this region near last November’s
swing high
, which closely aligns with the
opening price
of a
stock gap
in early December.
The next overhead area of interest lies at the $196. Investors who have bought the stock at lower prices may look for
profit taking
opportunities in this area near the upper range of a
consolidation
period that formed on the chart throughout most of December and January.
Critical Support Level Worth Watching
Finally, a loss of buying
momentum
could see a
pullback
to around $155. Alphabet shares would likely attract buying interest in this location near yesterday’s breakout point, an area that also roughly lines up with the early August 2024
swing low
.
The comments, opinions, and analyses expressed on Investopedia are for informational purposes only. Read our
warranty and liability disclaimer
for more info.
As of the date this article was written, the author does not own any of the above securities.
Read the original article on
Investopedia
