
Watch These ServiceNow Price Levels as Stock Pops on Strong Earnings, Outlook

Key Takeaways
ServiceNow (
NOW
) shares surged in extended trading on Wednesday after the enterprise software provider posted better-than-expected quarterly results and issued a subscription
revenue
outlook that surpassed Wall Street expectations.
Through Wednesday’s close, ServiceNow shares had lost nearly a quarter of their value since the start of the year, weighed down in part by concerns that the company’s revenue could take a hit from the Trump administration’s efforts to rein in government spending.
The
uncertainty surrounding Trump’s plans for tariffs
is also a concern for businesses, but ServiceNow CFO Gina Mastantuono said she’s “very confident” in the company’s “ability to navigate these rapidly evolving times,”
Barron’s
reported. She added that demand signals from business leaders remain strong.
ServiceNow shares rose more than 10% in after-hours trading to about $898.
Below, we take a closer look at Service Now’s chart and apply
technical analysis
to identify crucial post-earnings price levels worth watching out for.
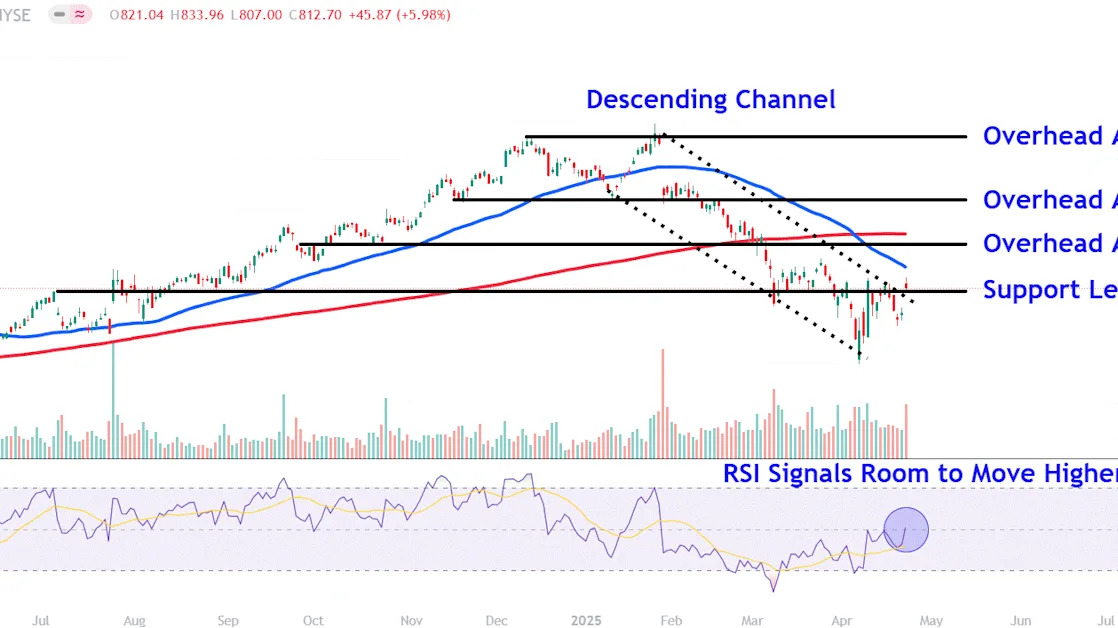
Descending Channel Breakout
Since completing a
double top
in late January, ServiceNow shares trended lower within a
descending channel
for several months before breaking out above the pattern’s upper trendline on Wednesday, setting the stage for a bullish trend
reversal
.
Importantly, the
relative strength index (RSI)
confirms bullish momentum, though the indicator remains well below
overbought
levels, giving the stock ample room to climb.
Let’s identify three crucial overhead areas on ServiceNow’s chart worth watching and also point out an important
support level
to eye during
pullbacks
.
Crucial Overhead Areas Worth Watching
The first higher level to watch sits around $900. The shares could encounter overhead
resistance
in this area near a trendline that connects a range of comparable
price action
on the chart extending back to last September.
A convincing close above this level may fuel a move to the psychological $1,000 level. Investors who have purchased shares at lower prices could look for
profit-taking
opportunities in this region near the mid-February
countertrend
peak, an area that closely aligns with a minor
retracement
in the stock last November.
Further buying could underpin a move up to $1,160. This area on the chart would likely attract considerable attention near the prominent December and January
peaks
that marked the stock’s double top.
Important Support Level to Eye
Finally, a loss of upside earnings-driven momentum could see ServiceNow shares retrace to around $807. However, investors would likely view this area as a high-probability
entry point
near the initial
breakout
location, which also lines up with several peaks and troughs on the chart stretching back to July last year.
The comments, opinions, and analyses expressed on Investopedia are for informational purposes only. Read our
warranty and liability disclaimer
for more info.
As of the date this article was written, the author does not own any of the above securities.
Read the original article on
Investopedia
