
Watch These AMD Price Levels as Stock Slides Amid New U.S. Rules on Chip Exports to China

Key Takeaways
Advanced Micro Devices (
AMD
) shares lost ground again Thursday, a day after the chipmaker joined a
sector-wide sell-off
following news that the U.S. had imposed new licensing requirements on some AI chip exports to China.
AMD said via a regulatory filing that the new chip curbs would see it face charges of up to $800 million related to the export of its MI308
graphics processing unit (GPU)
, a chip designed for compute-intensive applications, such as AI and
gaming
.
AMD shares have tumbled 28% since the start of the year and lost 43% of their value over the past 12 months amid concerns about slowing AI infrastructure spending and the company’s inability to capture a greater share of the AI chip market from sector bellwether Nvidia (
NVDA
). The Trump administration’s trade policies have added to the uncertainty surrounding the stock.
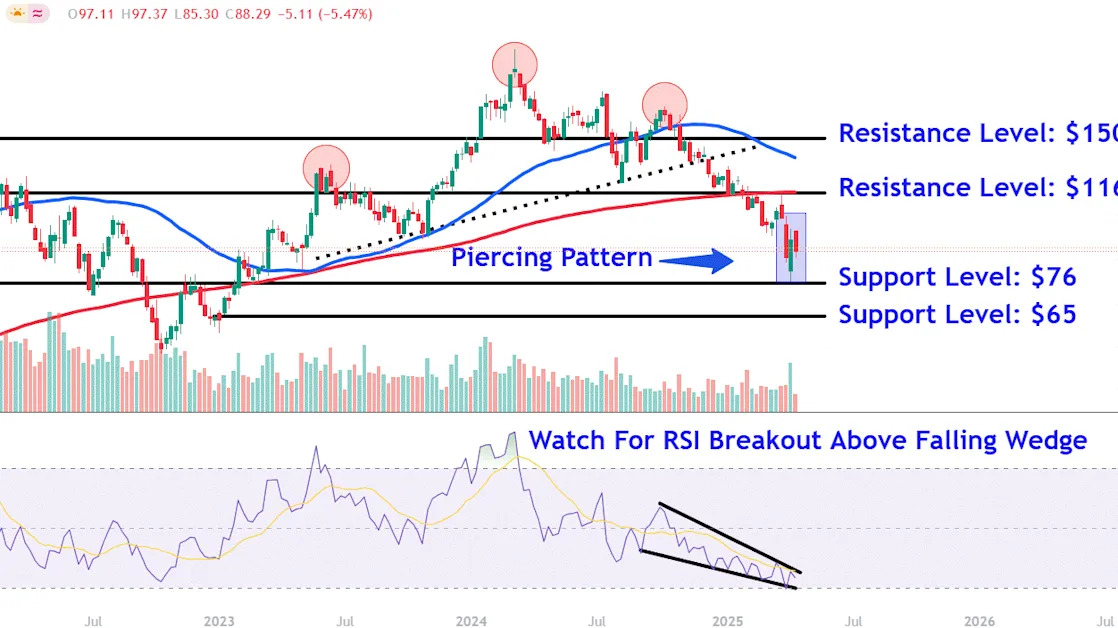
Below we analyze AMD’s
weekly chart
and identify major price levels that investors will likely be watching.
Piercing Pattern Marks Potential Reversal
After breaking down below the
neckline
of a
head and shoulders formation
in December, AMD shares trended sharply lower until last week’s
volume
-backed rebound, potentially laying the groundwork for a longer-term
reversal
.
Importantly, the move created a
piercing pattern
, a two-day candlestick price pattern that marks a potential reversal from a downward trend to an upward trend.
However, selling resumed this week, with the
relative strength index (RSI)
edging back toward
oversold
levels to confirm bearish short-term price momentum. Looking ahead, investors should watch for the indicator to potentially break out above a
falling wedge pattern
it has formed over the past seven months.
Let’s locate major
support and resistance
levels by applying
technical analysis
to AMD’s chart.
Major Support Levels to Watch
AMD shares fell 0.9% to $87.50 on Thursday.
The first lower level to watch sits around $76. This area would likely attract significant scrutiny near last week’s low, which also closely aligns with a range of corresponding trading activity on the chart stretching back to September 2020.
Selling below this level opens the door for a retest of lower support at $65. Investors could seek buying opportunities in this location near the December 2022
retracement
low, a region the marked the start of a 14-month
uptrend
in the stock.
Important Resistance Levels to Watch
A move higher from current levels could see the shares initially climb to around $116. This region provides a
confluence
of selling pressure near the 200-week moving average, last month’s
countertrend
high, and a range of comparable price points on the chart extending back to August 2021.
Finally, a longer-term trend reversal in the stock could fuel a rally to $150. Investors who have
accumulated shares
during the stock’s downtrend may look for
profit-taking
opportunities in this location near a
horizontal line
that connects several minor peaks on the chart between December 2021 and August last year. Depending on the timing of such a move, AMD shares may also encounter resistance in this area from the head and shoulders’ neckline.
The comments, opinions, and analyses expressed on Investopedia are for informational purposes only. Read our
warranty and liability disclaimer
for more info.
As of the date this article was written, the author does not own any of the above securities.
Read the original article on
Investopedia
