
Watch These Nvidia Stock Price Levels as Chip Export Curb Set to Hit Earnings

Key Takeaways
Nvidia (
NVDA
) shares tumbled nearly 7% Wednesday after
the company said
it’s set to take a $5.5 billion charge as a result of U.S. restrictions on exports of its AI chips to China.
The company said via a regulatory filing that it would be required to have an export license to sell its popular H20 chips to China amid concerns they could be used by Beijing to build a
supercomputer
. The development caught market watchers off guard, given Nvidia designed the H20
graphics processing units (GPUs)
to comply with Biden-era chip export curbs on advanced chips the former administration thought could be used by foreign adversaries.
Nvidia shares have staged a modest recovery above this month’s low but have lost about a firth of their value since the start of the year as of Wednesday’s close amid uncertainty over Washington’s
trade policies
and
big tech AI spending
.
Below, we take a closer look at Nvidia’s chart and apply
technical analysis
to point out key price levels worth watching out for.
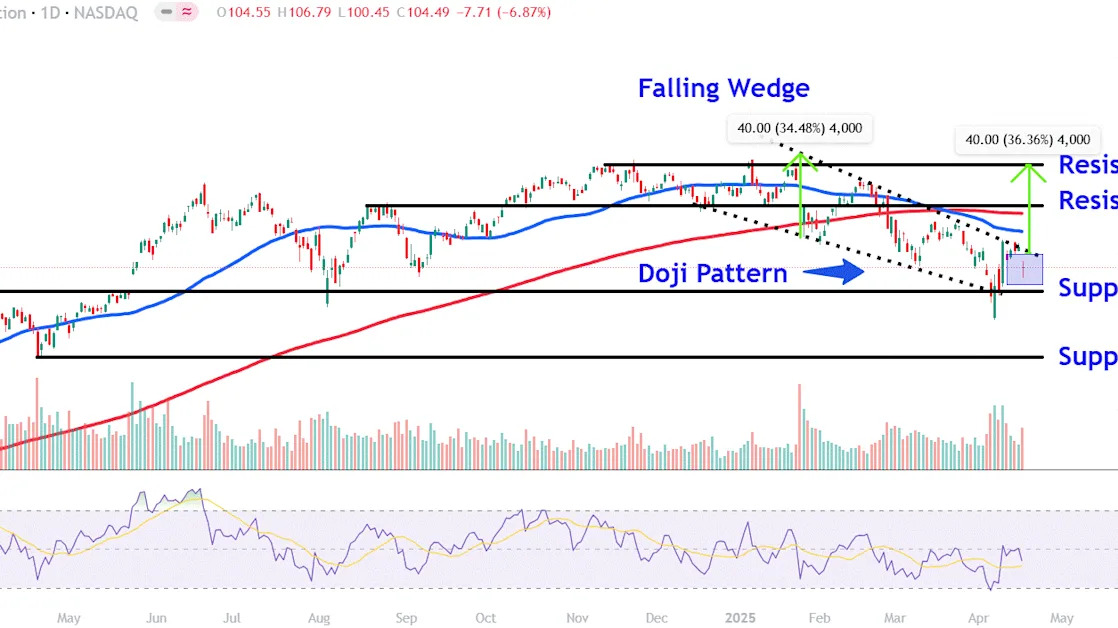
Doji Candlestick Pattern Indicates Indecision
After attracting buying interest near the lower trendline of a
falling wedge
pattern last week, Nvidia shares rallied sharply before running into selling pressure near the pattern’s top trendline.
It’s worth noting that although the stock fell sharply in Wednesday’s trading session, the price formed a
doji
, a candlestick pattern suggesting indecision between buyers and sellers.
Let’s identify key
support and resistance
levels on Nvidia’s chart that investors may be monitoring.
Key Support Levels to Watch
Nvidia shares fell 6.9% to close Wednesday’s session at $104.49.
Further selling in the stock could initially see the price revisit support around $96. This area may attract buyers near last year’s prominent March twin
peaks
, a location on the chart also situated just above this month’s tariff-driven low.
The bulls’ failure to defend the April low could trigger a larger drop to the $76 level. Investors may look for
buy-and-hold
entry points in this region near last April’s notable
swing low
.
Important Resistance Levels to Monitor
A
volume
-backed breakout above the falling wedge pattern’s top trendline could drive a move to around $130, currently just above the
200-day moving average
. The shares may face overhead resistance in this area near the August peak and December trough.
Finally, buying above this level could see Nvidia shares climb to $150. Investors may decide to
lock in profits
at this price near several peaks that formed on the chart just below the stock’s
record high
set in early January.
This area also aligns with a projected measured move
price target
that calculates the depth of the falling wedge in
points
and adds that amount to the pattern’s upper trendline. For instance, adding $40 to $110 forecasts an
upside
target of $150.
The comments, opinions, and analyses expressed on Investopedia are for informational purposes only. Read our
warranty and liability disclaimer
for more info.
As of the date this article was written, the author does not own any of the above securities.
Read the original article on
Investopedia
