
Watch These Boeing Price Levels as Stock Faces US-China Trade War Turbulence

Key Takeaways
Boeing (
BA
) shares remained in focus Wednesday as investors
digested yesterday’s reports
that China told its airlines not to take more deliveries of the American company’s jets amid an intensify trade war between Washington and Beijing.
The development adds to a difficult 12 months for the plane maker’s stock, which has struggled to gain investors’ confidence after several highly publicized safety and manufacturing mishaps, compounded by a
seven-week machinists strike
, all of which weakened the company’s
balance sheet
.
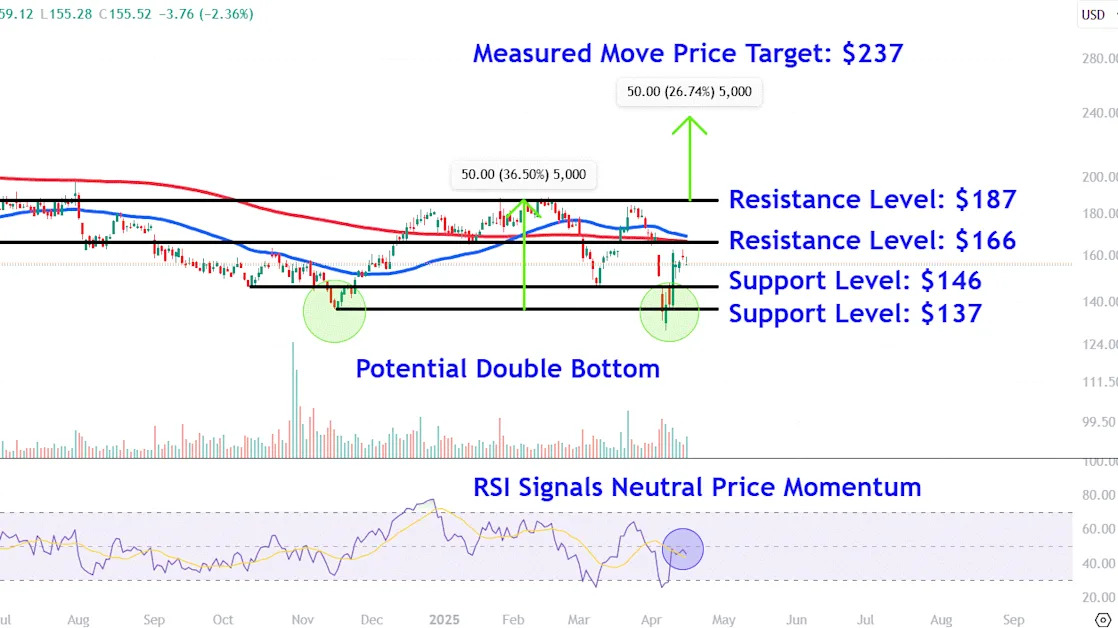
Boeing shares were up 1.3% at $157.50 in mid-afternoon trading Wednesday. The stock has lost about 11% of its value since the start of the year.
Below, we break down the
technicals
on Boeing’s chart and point out important price levels that investors may be watching.
Potential Double Bottom
Tariff-driven selling in Boeing shares saw the price temporarily drop last week below the prominent November swing low, before promptly rebounding above that level to potentially form a
double bottom
.
More recently, the stock has drifted mostly sideways since last Wednesday’s
wide-ranging day
, with the
relative strength index (RSI)
providing a reading just below the 50 threshold to signal neutral price momentum.
Let’s identify important
support and resistance
levels on Boeing’s chart and forecast a measured move
price target
to put on the radar.
Important Support Levels to Watch
The first support area to watch sits around $146. A
retracement
to this level could attract buying interest near a
trendline
that connects a range of comparable trading activity on the chart stretching back to mid-April last year.
A close below this level could see the shares revisit lower support at $137. Investors will likely keep a close on this area near the closely aligned November and April
troughs
that form the potential double bottom.
Crucial Resistance Levels to Monitor
A tailwind from current levels could see the shares initially climb to $166. This location provides a
confluence
of overhead resistance near the
200-day moving average
and a series of swing lows that developed on the chart between April 2024 and January this year.
Further
upside
may accelerate a move to around $187. The shares could face headwinds in this region near multiple peaks on the chart from last May to February.
Measured Move Target to Put on the Radar
Investors can forecast an upside target using the measured move technique, also known by chart watchers as the
measuring principle
.
When applied to Boeing’s chart, we calculate the distance of the double bottom in
points
and add that amount to the pattern’s
neckline
. For example, we add $50 to $187, which projects a target of $237, around 52% above Tuesday’s closing price.
The comments, opinions, and analyses expressed on Investopedia are for informational purposes only. Read our
warranty and liability disclaimer
for more info.
As of the date this article was written, the author does not own any of the above securities.
Read the original article on
Investopedia
