
Watch These Humana Price Levels After Stock Soars on Medicare Payment Increase

Key Takeaways
Humana (
HUM
) shares jumped in extended trading on Monday after the federal government said it would
pay Medicare insurers more next year than previously expected
.
The
Centers for Medicare & Medicaid Services (CMS)
said payments for 2026
Medicare Advantage
health plans run by private insurers will increase by 5.06% on average, more than the 2.83% the government initially proposed in January. The boosted rates will benefit health insurance giants such as Humana, which has grappled with rising medical expenses related to government-backed health plans.
Humana shares trade flat since the start of the year as of Monday’s close but have slumped nearly 20% over the past 12 months, weighed down by increasing medical costs,
downgraded Medicare offerings
, and moderating membership signups. The stock rose 11% to $283.50 in after-hours trading Monday.
Below, we take a closer look at Humana’s chart and apply
technical analysis
to identify key price levels worth watching out for.
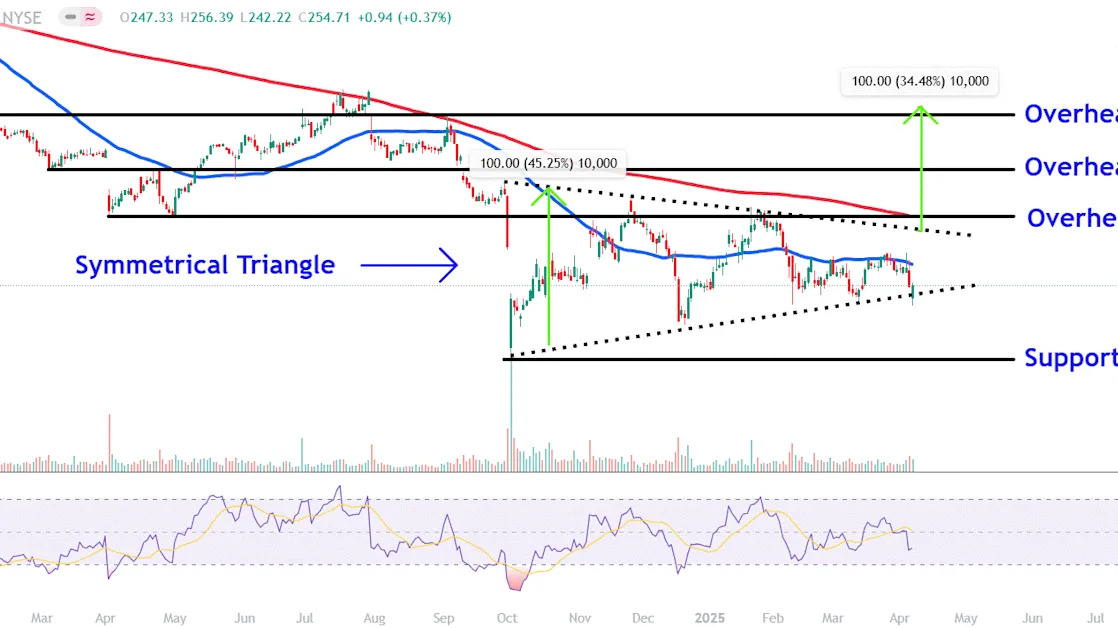
Symmetrical Triangle in Play
Since plumbing their
52-week low
last October, Humana shares have traded within a
symmetrical triangle
, a chart pattern indicating a period of
consolidation
before the price breaks out.
The stock broke down below the pattern in Monday’s trading session before staging an impressive intraday
reversal
to close above its lower trendline, signaling a
bullish
shift in investor sentiment.
Indeed, the shares look set to open sharply higher on Tuesday morning, potentially setting the stage for a longer-term
upside
trend reversal.
Let’s identify three key technical overhead areas on Humana’s chart and also locate an important
support level
worth monitoring if the stock resumes its established
downtrend
.
Key Overhead Areas to Watch
A
breakout
above the symmetrical triangle’s upper trendline could see the shares initially test the psychological $300 area. This level may provide significant overhead resistance near the
200-day moving average (MA)
and several prominent
peaks and troughs
on the chart stretching back to early April last year.
The next overhead area to watch sits around $336. Investors who have bought at lower prices may look for
profit-taking
opportunities in this location near the March through and April peak.
Further buying in the stock could fuel a move to the $383 area. The share may run into selling pressure in this region near
swing highs
that formed on the chart in January and September last year. This location also roughly aligns with a measured move upside target that calculates the distance of the symmetrical triangle near its widest point and adds that amount to the pattern’s top trendline.
Important Support Level Worth Monitoring
Finally, If Humana shares resume their long-term downtrend, investors should keep tabs on the $213 level. This area would likely attract significant attention near last year’s October
gap
low, which also marks the lowest point of the symmetrical triangle.
The comments, opinions, and analyses expressed on Investopedia are for informational purposes only. Read our
warranty and liability disclaimer
for more info.
As of the date this article was written, the author does not own any of the above securities.
Read the original article on
Investopedia
