
Watch These Nike Price Levels as Stock Plunges to 7-Year Low on Tariff Worries
Key Takeaways
Nike (
NKE
) shares tumbled Thursday amid concerns that the Trump administration’s recently announced reciprocal tariffs could weigh on the company’s profits.
Under Washington’s new levies, Nike’s key manufacturing partners in Vietnam, Indonesia, Cambodia, and China will be
subject to lofty import duties
ranging from 32% to 49%, prompting worries that
rising production costs and consumer prices
could shrink margins and slow demand.
Morgan Stanley recently said that investors are under-appreciating the potential impact of tariffs on Vietnam, a country where the sports gear giant manufactured about half of its footwear in fiscal 2024.
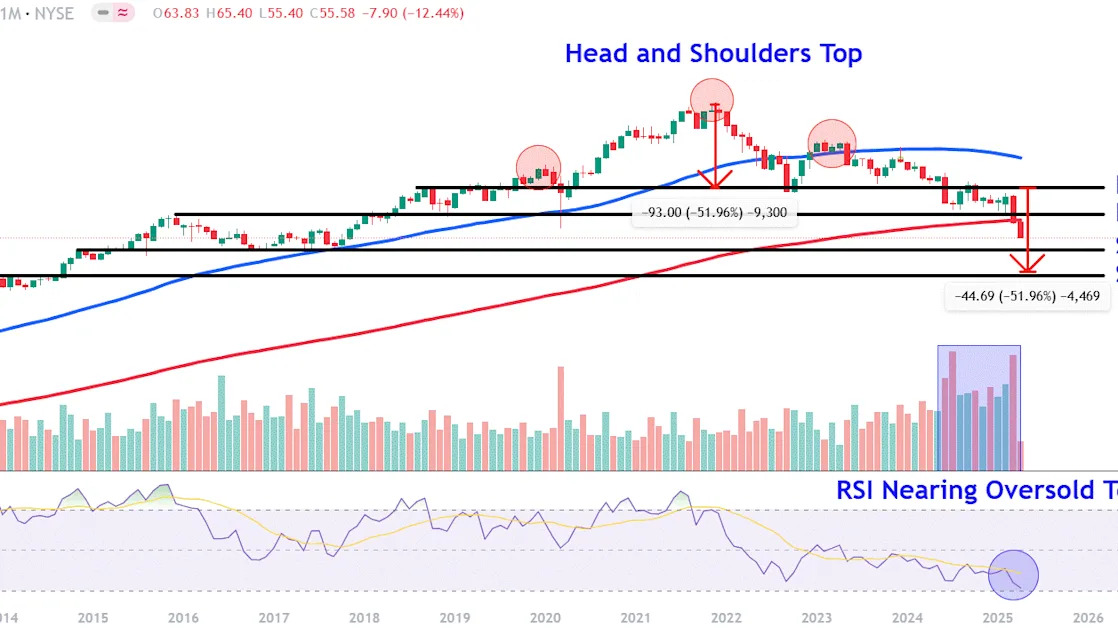
Nike was the biggest decliner in the Dow Jones Industrial Average on Thursday, falling 14% to $55.58, closing at its lowest level since December 2017. Shares have lost 27% of their value since the start of the year, with both tariff uncertainty and a weak sales outlook pressuring the stock.
Below, we zoom out on Nike’s
monthly chart
to identify crucial historical price level that investors may be watching.
Head and Shoulders Breakdown Accelerates Selling
Since breaking down below the
neckline
of a
head and shoulders
pattern last June, Nike shares have continued to trend sharply lower.
More recently, selling has accelerated on above-average
trading volume
, with the price falling decisively below the 200-month moving average to kick off April following Trump’s tariffs announcement.
While the
relative strength index (RSI)
confirms bearish price momentum with a reading below 50, the indicator continues tracking toward
oversold
territory, potentially increasing the chances of a near-term bounce.
Let’s identify crucial
support and resistance
levels on Nike’s chart by applying
technical analysis
.
Crucial Support Levels to Watch
Continued selling could see the shares tumble to the
psychological
$50 level. This area may provide support near the November 2014 peak and lower range of a 12-month
consolidation
period that formed on the chart between October 2016 and October 2017.
A drop below this level opens the door for a move to lower support around $40. Investors may look to
accumulate shares
in this region near a brief
sideways trend
on the chart that followed the stock’s impulsive move higher throughout 2013.
This location also roughly aligns with a projected measured move
downside
target that calculates the percentage decline from the top of the head and shoulders formation to the pattern’s neckline and deducts that change from the
breakdown
point.
Key Resistance Levels Worth Monitoring
During upswings in the stock, investors should initially monitor the $68 level. This area would likely provide overhead selling pressure near a
horizontal line
that connects multiple
peaks and troughs
on the chart from December 2015 to February this year.
Finally, the
bulls
’ ability to reclaim this key technical level could see Nike shares move up to around $86. Investors who have bought at lower prices may seek
exit points
in this location on a retest of the head and shoulders’ neckline.
The comments, opinions, and analyses expressed on Investopedia are for informational purposes only. Read our
warranty and liability disclaimer
for more info.
As of the date this article was written, the author does not own any of the above securities.
Read the original article on
Investopedia
