
Tesla Stock Rises for 5th Straight Session—Watch These Key Price Levels

Key Takeaways
Tesla (
TSLA
) shares closed higher Tuesday for the fifth straight session as the EV maker recovers some of the ground lost during a two-month selloff.
The latest gains come after an
all-hands meeting last week
where CEO Elon Musk urged employees to hold their Tesla shares, arguing that Wall Street doesn’t fully understand the company’s value based on its
self-driving
technology and
robotics
products. Tuesday’s share price increase came despite news that Tesla’s sales in the European Union
fell sharply in February
for the second consecutive month.
Shares of Tesla had rallied following Donald Trump’s election win in November as investors were optimistic about Musk’s proximity to the administration. After Trump was inaugurated in January, however,
shares slumped
as some investors saw Musk’s
involvement as hurting
Tesla’s brand amid
declining sales
and
protests
, along with uncertainty over how tariffs will
impact its business
.
The stock, which came into this week on a nine-week losing streak, is still down about 40% from its record high set in December. Tesla shares rose 3.5% on Tuesday to finish the session at $288.14—above where they were when Trump was elected—and have gained 28% over the past five sessions.
Below, we take a closer look at Tesla’s
weekly chart
and apply
technical analysis
to identify key price levels that investors may be watching.
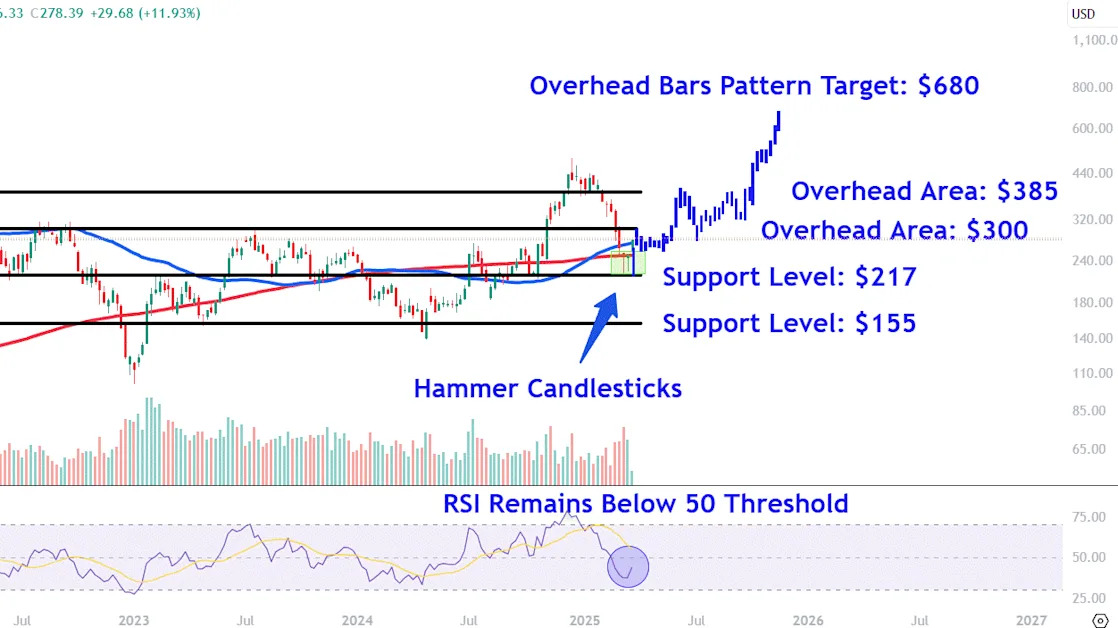
Hammer Candles Put Brakes on Recent Selling
After briefly dropping below the 200-week moving average (MA) in recent weeks, Tesla shares have reversed gear to climb back above the closely watched indicator, forming two bullish
hammer candlesticks
in the process.
It’s also worth pointing out that the 50-week MA crossed back above the 200-week MA in January to form a
golden cross
, a respected chart pattern that indicates higher prices.
However, while the
relative strength index (RSI)
has turned higher for the first time since mid-January, it still remains below the 50 threshold, signaling sluggish price momentum.
Let’s identify three key areas of overhead interest on Tesla’s chart to watch and also locate important
support levels
that may come into play during retracements.
Key Areas of Overhead Interest to Watch
Acceleration of the current move higher could see the shares initially rally to around $300. This region on the chart would likely attract significant interest near the
psychological round number
and a trendline that connects several major
swing highs
on the chart between January 2021 and July 2023.
Further upside could trigger buying up to the $385 area. Investors may seek
exit points
at this level near three peaks that formed on the chart from November 2021 to April 2022.
A rise into
price discovery
mode could drive a move to around $680. We projected this overhead target by taking the price bars that comprise the stock’s
uptrend
from April to December last year and overlay them from this month’s low. Interestingly, the prior move higher followed a drawdown of around 55%, a similarly sized drop to the stock’s recent
correction
.
Important Support Levels That May Come Into Play
A loss of momentum could see the shares decline to the $217 level, a region that may provide support near this month’s low, along with a range of other
peaks and troughs
on the chart stretching back to May 2022.
Finally, a resumption of recent selling in Tesla shares opens the door for a drop to lower support around $155. Investors could seek
buy-and-hold
opportunities in this location near a
horizontal line
that links an array of comparable price points on the chart from August 2020 to April last year.
The comments, opinions, and analyses expressed on Investopedia are for informational purposes only. Read our
warranty and liability disclaimer
for more info.
As of the date this article was written, the author does not own any of the above securities.
Read the original article on
Investopedia
