
Watch These Apple Stock Price Levels as Sell-Off Continues

Key Takeaways
Apple (
AAPL
) shares remained under pressure on Wednesday, bucking a broader rally for tech stocks.
Shares in the iPhone maker have come under heavy selling pressure this week following news that the company is
delaying the rollout of several AI features to Siri
, which analysts argue could dent iPhone sales. The threat of
looming tariffs
also continues to weigh on sentiment amid growing concerns that import duties imposed by the Trump administration could eat into the company’s
gross margins
, given it manufactures the majority of its devices in China.
Apple shares, which experienced their biggest one-day drop in two-and-a-half years on Monday, have fallen 17% since hitting a record high in December. The stock was down 2.2% at $216 in late trading Wednesday.
Below, we take a closer look at Apple’s chart and use
technical analysis
to identify major price levels worth watching out for.
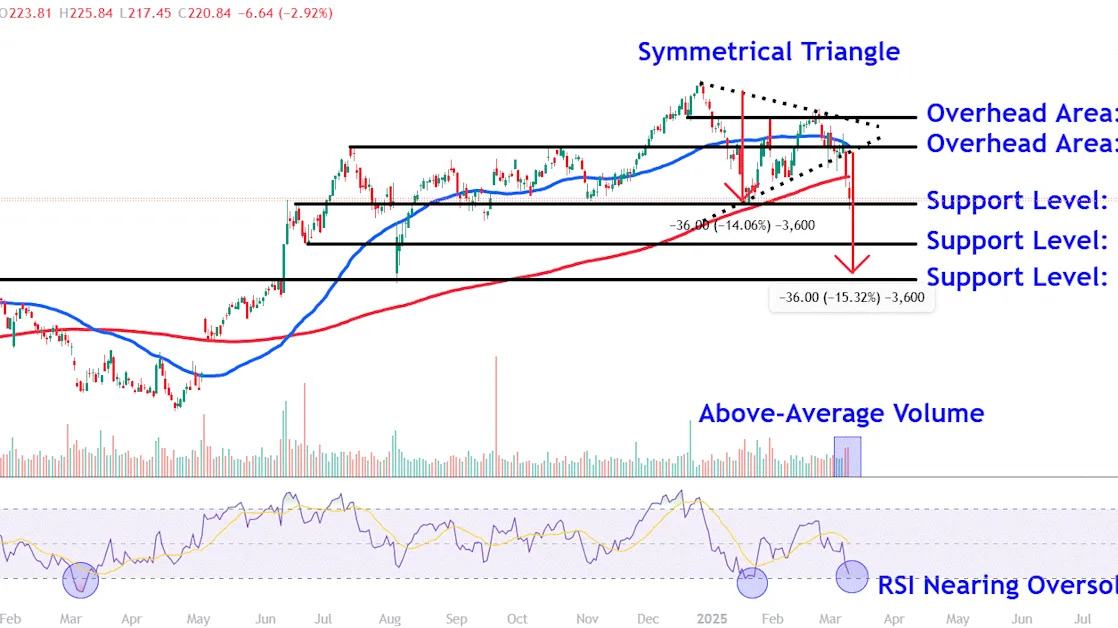
Symmetrical Triangle Breakdown
After setting a
record high
in late December, Apple shares consolidated within a
symmetrical triangle
before staging a decisive
breakdown
below the pattern and closely watched
200-day moving average
this week.
Importantly, above-average
volume
has accompanied the move lower, indicating selling conviction by larger market participants.
While the
relative strength index (RSI)
confirms bearish price momentum with a reading below 50, the indicator sits near
oversold
territory, a region that has for several years provided attractive
tactical trading
opportunities in the stock.
Let’s locate major
support levels
to watch amid the possibility for further selling and also identify several key overhead areas to monitor if the stock resumes it longer-term
uptrend
.
Major Support Levels to Watch
Entering Wednesday’s session, the $219 level was an area where the stock was expected to find support from a trendline that connects a range of similar price points on the chart between June last year and January this year. The stock had fallen below this location in
intraday trading
on Tuesday, but it reclaimed the area by yesterday’s close.
Selling below this level could see the shares fall to around $207. This region may attract buying interest near last year’s late June
pullback
low that formed within a broader uptrend that played out in the stock between April and July.
A more significant drop could bring lower support at the $197 level into play, an area where investors may seek
entry points
near the prominent December 2023
peak
and August 2024 trough. This location on the chart also roughly aligns with a measured move
price target
, which calculates the depth of the symmetrical triangle and deducts that amount from the pattern’s breakdown area. For instance, deducting $36 from $235 projects a downside target of $199.
Key Overhead Areas to Monitor
The first overhead area to monitor sits around $237. A retest of this level finds a
confluence
of
resistance
from the symmetrical triangle’s lower trendline and two key peaks that formed on the chart in October and July last year.
Finally, buying above this region could see Apple shares climb to the $247 area, a location on the chart where they may run into selling pressure near the symmetrical triangle’s top trendline, which also closely corresponds with last month’s peak and a mid-December
retracement
low.
The comments, opinions, and analyses expressed on Investopedia are for informational purposes only. Read our
warranty and liability disclaimer
for more info.
As of the date this article was written, the author does not own any of the above securities.
Read the original article on
Investopedia
