
Watch These Broadcom Price Levels as Stock Follows Nvidia Lower in Chip Stock Selloff

Key Takeaways
Broadcom (
AVGO
) shares may remain on watchlists after falling 7% to a one-month low Thursday amid a broader
chip stock selloff
as investors digested
earnings from Nvidia
(
NVDA
) and President Trump’s
latest announcement on tariffs
.
The market’s response to Nvidia’s results suggests that while the AI favorite’s earnings came in ahead of Street expectations, investors may have been looking for more, given mounting concerns over
AI spending
and uncertainty about the potential impact of the Trump administration’s policies relating to tariffs and AI chip export curbs.
Broadcom shares have lost about 15% of their value since the start of the year through Thursday’s close, but have gained more than 50% over the past 12 months as demand for its chips to support AI surged, with Bernstein analysts suggesting in December that the
chipmaker could be having its “Nvidia moment
.”
Below, we take a closer look at Broadcom’s chart and use
technical analysis
to point out key price levels worth watching out for.
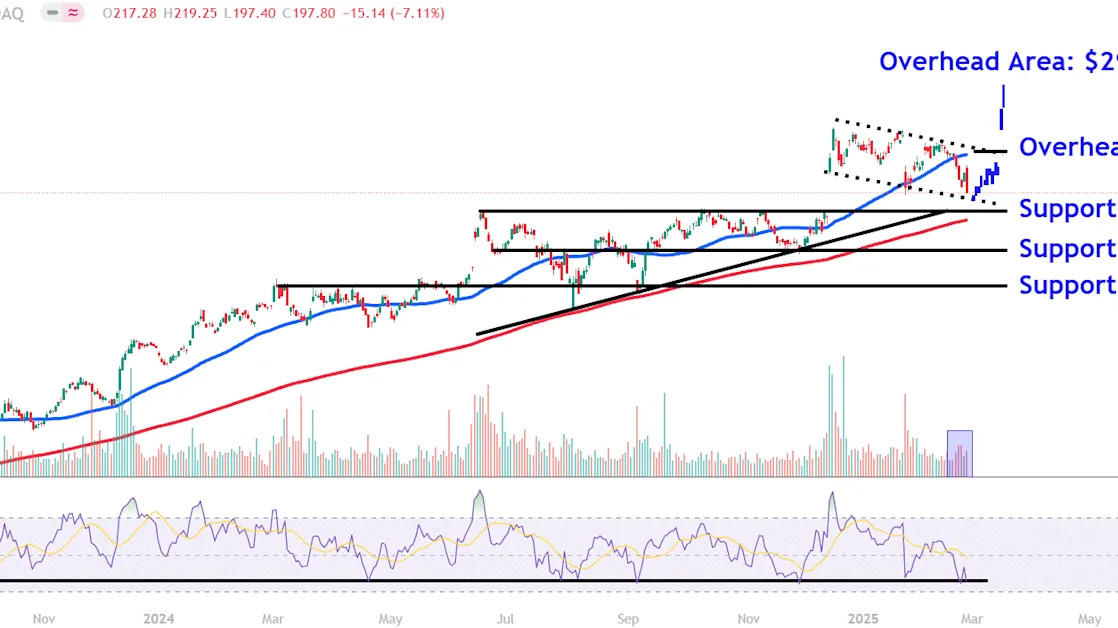
Descending Channel Takes Shape
Since setting a new
all-time high (ATH)
in mid-December, Broadcom shares have consolidated within a
descending channel
. More recently, selling from the pattern’s top trendline has accelerated, with the price falling below the respected
50-day moving average (MA)
on increasing
trading volume
.
While the
relative strength index (RSI)
confirms bearish momentum with a reading below 40, the indicator sits at a level that often coincides with local bottoms in the stock.
Below, we identify three
support levels
that could be worth watching if the shares continue to fall and key overhead areas to monitor if the stock resumes its longer-term move higher.
Major Support Levels to Watch
The first lower level in play sits around $185. This area, currently positioned just below the descending channel, could find support near the top trendline of a prior
ascending triangle
on the chart and the nearby
200-day MA
.
A decisive close below this price could see the shares decline to the $160 level, a location that may provide a floor near several
troughs
that formed on the chart in June and November last year.
Further selling could bring lower support around $140 into play. Such a drop may attract investors looking for buying opportunities near a
horizontal line
that connects a range of similar price points on the chart from March through to September.
Key Overhead Areas to Monitor
If Broadcom shares resume their longer-term
uptrend
, investors should watch how the price responds to the descending channel’s top trendline. The upper area of the pattern currently sits at about $230 near the 50-day MA, but will move lower over time.
Finally, investors could forecast a more speculative upside target by using the bars pattern tool. This technique works by taking Broadcom’s
trending
move higher from late November to mid-December and repositioning it from the descending channel’s lower trendline, which projects a target of around $295. This analysis assumes that a
continuation
move may play out in the stock.
The comments, opinions, and analyses expressed on Investopedia are for informational purposes only. Read our
warranty and liability disclaimer
for more info.
As of the date this article was written, the author does not own any of the above securities.
Read the original article on
Investopedia
