
Watch These Palantir Stock Price Levels as Sell-Off From Last Week’s High Accelerates

Key Takeaways
Palantir Technologies (
PLTR
) stock fell again Tuesday to extend a swift decline from record highs amid investor concerns that the U.S. government could cut spending on the analytical software company’s services.
The stock has tumbled 30% since setting its record high last Wednesday following a report that Pentagon officials had been ordered to
cut the U.S. defense budget by 8% annually for the next five years
, a move that could negatively impact a key military contractor like Palantir.
However, some analysts argue the sell-off provides a
buy-the-dip opportunity
, pointing out the company’s data analytics software stands to benefit from a federal push to improve efficiency across government agencies.
The stock was down about 3% at $88 in recent trading after falling more than 10% on Monday. Despite the recent selling, Palantir shares trade 17% higher since the start of the year and have gained roughly four fold over the past 12 months.
Below, we take a closer look at Palantir’s chart and use
technical analysis
to point out key price levels worth watching out for.
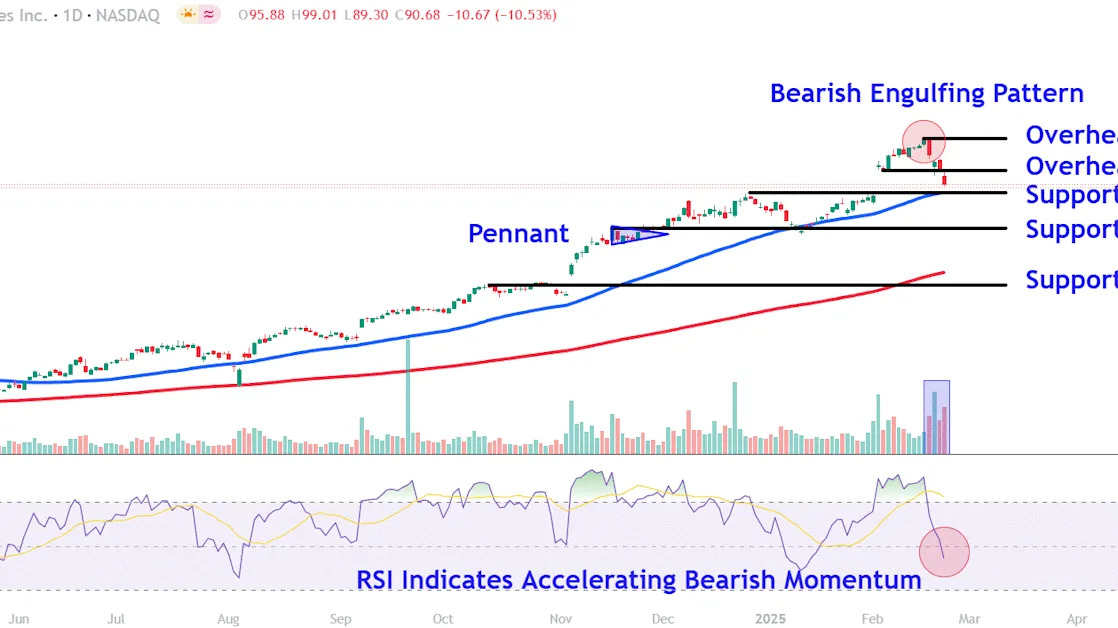
Accelerating Selling Momentum
Since a
bearish engulfing pattern
marked the stock’s record high earlier this month, Palantir shares have moved sharply lower, with the price threatening to close the early February earnings-driven
breakaway gap
.
Increasing
trading volume
during the recent drop indicates selling conviction, while the
relative strength index (RSI)
indicator’s sudden drop from
overbought
levels to below 50 also points to accelerating bearish momentum.
Let’s locate several key
support levels
where investors may look for buying opportunities if the shares continue to fall and also identify two important overhead areas worth eyeing during potential recovery efforts.
Key Support Levels to Watch
The first support level to watch sits around $85. A gap fill in this area could see investors seek
entry points
near the popular
50-day moving average
and prominent late-December peak
Selling below this level may see the shares revisit the $66 region. This area could attract buying interest around the January
trough
, which closely aligns with the top of a
pennant pattern
that formed on the chart in late November.
A more significant drop opens the door for selling down to around $44. Investors could look to
accumulate shares
in this location near the upper range of a
consolidation
period that emerged on the chart during the second half of October prior to the stock’s early-November gap.
Important Overhead Areas to Eye
During a recovery in the share price, investors should initially eye the $100 area. This location on the chart would likely attract attention near the
psychological round number
and this month’s breakaway gap day low.
The bulls’ ability to reclaim this important level could see the shares retest the $125 level, a location on the chart where investors who have bought at lower prices may look to
lock in profits
near the stock’s
all-time high
.
The comments, opinions, and analyses expressed on Investopedia are for informational purposes only. Read our
warranty and liability disclaimer
for more info.
As of the date this article was written, the author does not own any of the above securities.
Read the original article on
Investopedia
