
Watch These Berkshire Hathaway Price Levels After Stock Sets Record High

Key Takeaways
Berkshire Hathaway (
BRK.B
) shares jumped to a
record high
Monday after the conglomerate reported over the weekend that its
fourth-quarter operating earnings
surged more than 70% year-over-year.
Sentiment surrounding the stock may have also received a boost after CEO Warren Buffett said in his
annual letter to shareholders
that the
majority of the company’s money remains invested in equities
—and would continue to be—despite its record cash pile and recent stock sales.
Berkshire Class B shares rose 4.1% to $498.42 on Monday and have gained 10% since the start of the year. By comparison, the large cap
S&P 500
index has returned 1.7% so far in 2025.
Below, we break down the
technicals
on Berkshire’s chart and identify important price levels worth watching out for.
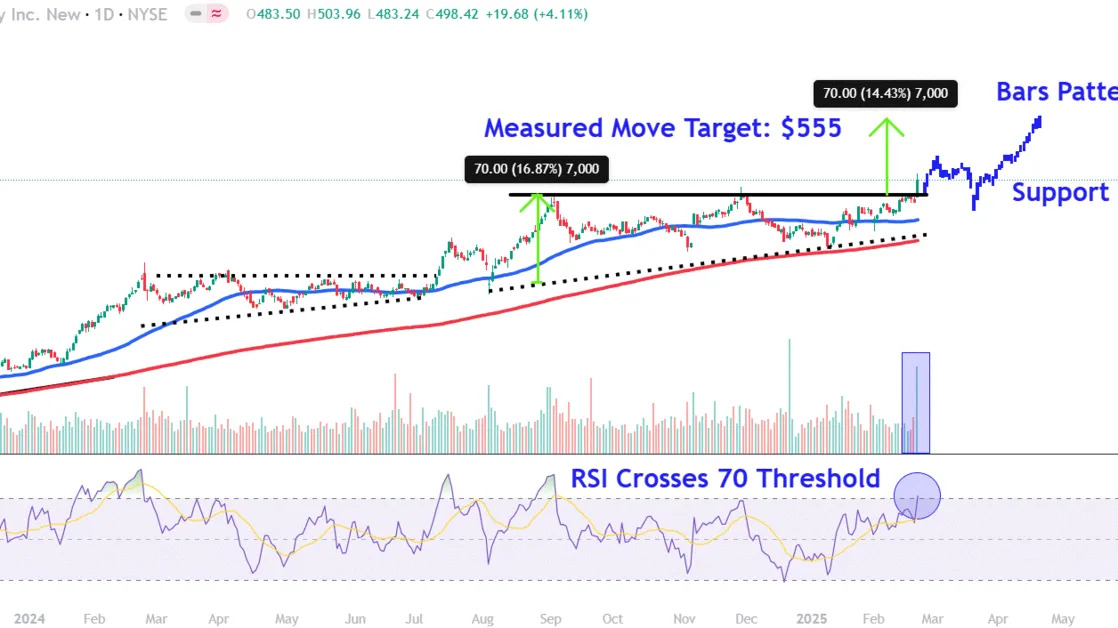
Ascending Triangle Breakout
Since bottoming out near the
200-day moving average
and the lower trendline of an
ascending triangle
, Berkshire shares have continued to trend higher, with the price breaking out above the pattern to a new
all-time high
today.
Importantly, the breakout occurred on the highest daily
volume
since December’s
triple witching
trading session, indicating institutional investors participated in the buying. Moreover, the
relative strength index (RSI)
confirms bullish price momentum with a reading above the 70 threshold, but also points to overbought conditions.
Let’s apply
technical analysis
to forecast potential upside
price targets
and also locate a key support level worth tracking during
pullbacks
.
Chart-Based Upside Targets
Measured Move Price Target
The measured move technique, also known as the
measuring principle
, forecasts an upside target by analyzing the depth of the ascending triangle to project a potential move higher. To apply the analysis to Berkshire’s chart, we calculate the distance between the pattern’s two trendlines near their widest section and add that amount to the breakout point. For instance, we add $70 to $485, which forecasts a target of $555.
Bars Pattern Price Target
Bars pattern analysis projects a possible upside target by studying prior trends to predict how a future directional move may play out. When applying this tool, we extract the price bars comprising the stock’s trend higher following an earlier ascending triangle on Berkshire’s chart and reposition them from the current pattern’s top trendline. This predicts a target of around $560.
Key Support Level to Track During Pullbacks
Finally, during pullbacks, investors should keep a close eye on the key $485 level. Investors who look for retracement
entry points
may see value in this area near the ascending triangle’s top trendline, which could flip from a place of prior
resistance
into an area of future support.
The comments, opinions, and analyses expressed on Investopedia are for informational purposes only. Read our
warranty and liability disclaimer
for more info.
As of the date this article was written, the author does not own any of the above securities.
Read the original article on
Investopedia
