
Watch These Tesla Stock Price Levels as February Slump Accelerates

Key Takeaways
Tesla (
TSLA
) shares fell again Monday, extending a recent slump that has made the stock the weakest performer in the
Magnificent 7
so far in 2025.
Tesla shares have tumbled 18% year-to-date as investors asses the impact of
potential tariffs
and the removal of EV incentives on the automaker’s business. However, the stock remains 31% higher since the early-November U.S. presidential election on expectations that CEO
Elon Musk’s
close ties with President Donald Trump will benefit the company.
Below, we take a closer look at the
technicals
on Tesla’s chart and identify key price levels that investors may be eyeing.
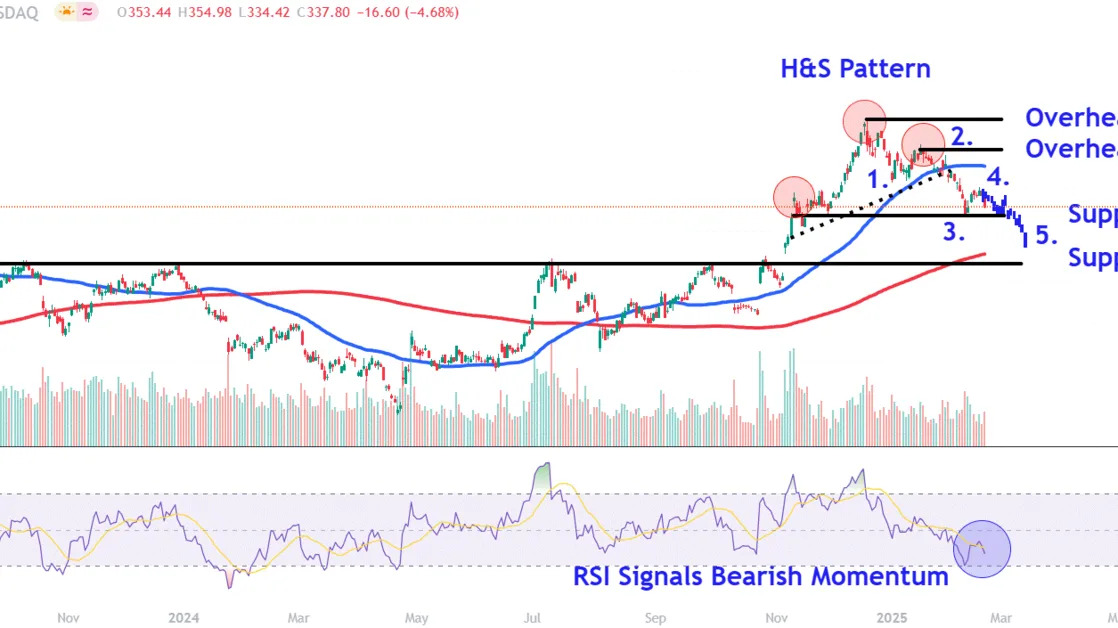
Head and Shoulders Pattern Adds Downward Pressure
Tesla shares have continued to trend lower after breaking down below the
50-day moving average (MA)
and
neckline
of a
head and shoulders pattern
earlier this month.
While the
relative strength index (RSI)
has recovered slightly from near
oversold
levels, the indicator still gives a reading below 40, signaling bearish price momentum.
Looking ahead, investors should keep an eye on two key
support levels
where Tesla shares may attract buying interest and also monitor a few important overhead areas that could provide
resistance
during potential upswings.
Key Support Levels to Watch
Tesla shares closed 2.2% lower at $330.53 on Monday.
Upon further selling, investors should initially keep an eye on the $325 level, which was briefly breached on Monday. This area on the chart could provide support near the February low, which also closely aligns with the lower range of a
consolidation
period situated just under the head and shoulders’ left shoulder.
The
bulls
’ failure to defend this level could see the shares fall to around $265. Investors may view this region as a buying opportunity, given its current proximity to the closely watched
200-day MA
and a trendline that connects multiple
peaks
on the chart extending back to September 2023.
This area also sits just below a projected bars pattern downside target that takes the stock’s
downtrend
from mid-January to early February and overlay’s it from this month’s
countertrend
high. Such a move would complete an
Elliot Wave
pattern with five distinct swings before a corrective phase typically occurs.
Important Overhead Areas to Monitor
During upswings in the stock, investors should initially keep track of the $430 area. The shares could face selling pressure in this region near the head and shoulders’ right shoulder.
Finally, a close above this level may propel a move to around $489. This chart location would likely attract significant attention near the stock’s
record high
, which also doubles as the peak of the head and shoulders pattern.
The comments, opinions, and analyses expressed on Investopedia are for informational purposes only. Read our
warranty and liability disclaimer
for more info.
As of the date this article was written, the author does not own any of the above securities.
Read the original article on
Investopedia
