
Watch These Alphabet Price Levels as Stock Tumbles After Earnings Report

Key Takeaways
Alphabet (
GOOGL
,
GOOG
) shares fell sharply Wednesday as
weaker-than-expected cloud revenue
overshadowed fourth-quarter earnings that came in ahead of analysts’ estimates.
The Google parent also said it
anticipates investing
about $75 billion in
capital expenditures
in 2025, with the lion’s share directed at expanding artificial intelligence infrastructure. That number was
higher than analysts expected
, highlighting investor concerns about when the spending will pay off.
The projection comes after the emergence last week of a sophisticated, cost-efficient AI model from
Chinese startup DeepSeek
, which put a spotlight on the significant investment U.S. tech giants have made in emerging AI technology.
Alphabet shares were down nearly 8% at around $190 in late trading. Despite today’s decline, the stock has gained 33% over the past 12 months, handily outpacing the S&P 500 during the period.
Below, we break down the
technicals
on Alphabet’s chart and identify important price levels worth watching.
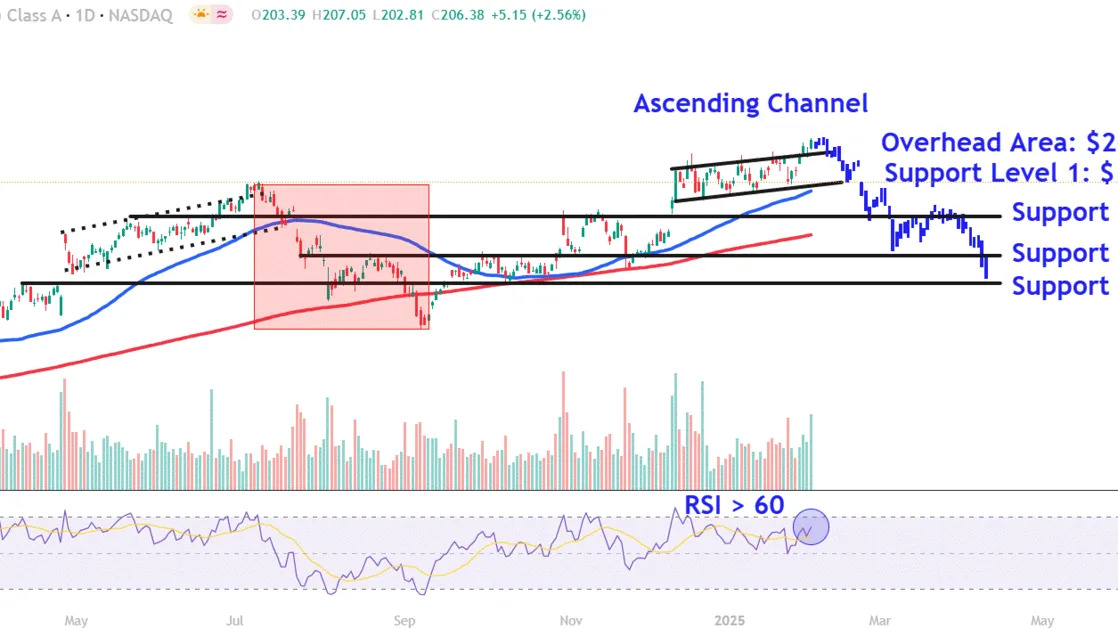
Ascending Channel in Focus
Alphabet shares traded in a narrow seven-week
ascending channel
before breaking out above the pattern late last month. The price continued to gain momentum ahead of the tech giant’s quarterly report, with the
relative strength index (RSI)
recently crossing above the 60 threshold.
However, a day after setting a record high, the weaker-than-expected cloud results disrupted the stock’s bullish
price action
, setting the stage for an abrupt
reversal
.
Let’s identify four important
support levels
to watch amid the possibility for further earnings-driven selling and also point out a crucial overhead area to monitor if the stock resumes its longer-term
uptrend
.
Important Support Levels to Watch
Firstly, it’s worth watching how the stock’s price responds to the $190 level. This area on the chart finds a
confluence
of support from the ascending channel’s lower trendline and the
50-day moving average
.
The
bulls
’ failure to defend this level could see the shares decline to around $180, a location where they may attract buying interest near the May, October, and November 2024 peaks.
Selling below this level may trigger a fall to the $168 level. Investors could look for
entry points
in this region near a trendline that links a range of
peaks and troughs
on the chart between July and November last year.
A deeper
correction
in the stock brings the $160 level into play. This area may provide support near a
horizontal line
that connects a series of comparable price points on the chart from April to October.
The location also roughly aligns with a projected bars pattern
downside
target that takes the stock’s downward move from July to September and repositions it from Tuesday’s close. Interestingly, that move followed a
failed break
from an ascending channel, potentially providing clues as to how a future correction from a similar setup may play out.
Key Overhead Area Monitor
During recovery efforts, investors should keep track of the $201 area. Investors who have purchased shares at lower prices may look to
lock in profits
near the ascending channel’s upper trendline, which currently sits just below the stock’s record high.
The comments, opinions, and analyses expressed on Investopedia are for informational purposes only. Read our
warranty and liability disclaimer
for more info.
As of the date this article was written, the author does not own any of the above securities.
Read the original article on
Investopedia
