
Apple Stock Price Levels to Watch After Earnings Report as iPhone Upgrades in Focus

Key Takeaways
Apple (
AAPL
) shares rose Friday morning after the company reported better-than-expected earnings and said customers are increasingly upgrading their iPhones to take advantage of AI features.
While the company reported a
drop in iPhone sales during the December quarter
due to regulatory hurdles in China and a slow rollout of its flagship Apple Intelligence features in other markets, profit topped expectations in the first first quarter as services revenue surged.
CEO Tim Cook said late Thursday in the company’s earnings call that
more customers upgraded their iPhones
last quarter than in any previous period, and that he expects Apple Intelligence to “go mainstream” as the base of iPhone 15 and iPhone 16 users grows. In April, Apple Intelligence will be made available in additional languages, including French, German, Italian, Portuguese, Spanish, Japanese, Korean, simplified Chinese, and localized English in Singapore and India.
Apple shares were up nearly 1% to around $240 in recent trading. The stock has gained 30% over the past 12 months, slightly outpacing the S&P 500 over that period.
Below, we break down the
technicals
on Apple’s
weekly chart
and identify crucial post-earnings price levels that investors may be monitoring.
Rising Wedge Pattern in Focus
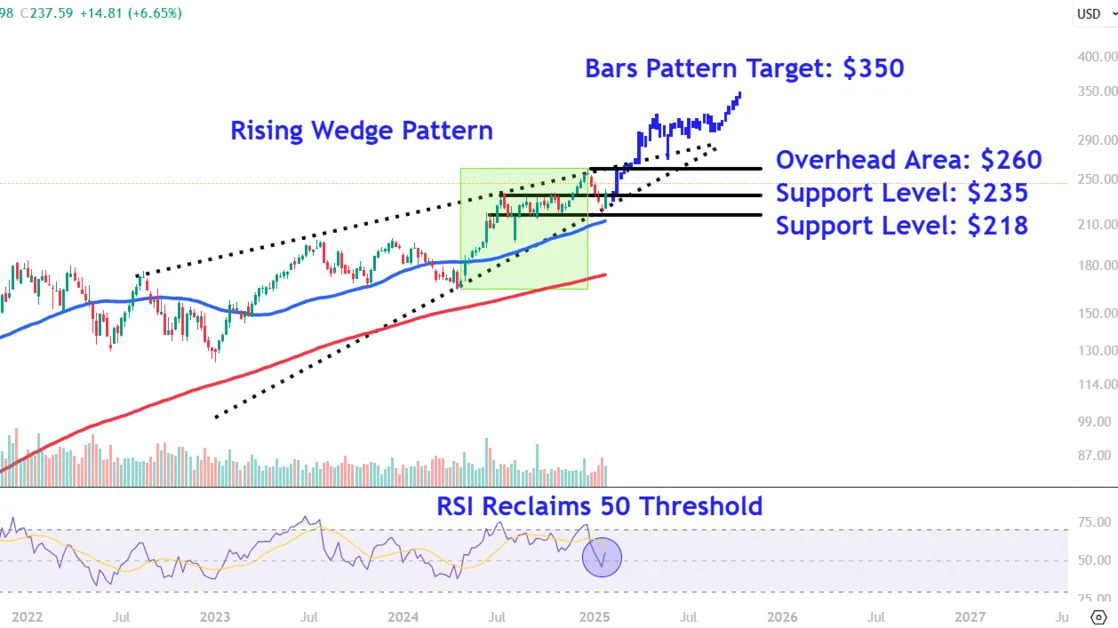
Apple shares have trended higher within an 18-month
rising wedge
, with the stock’s price recently finding buying interest near the pattern’s lower trendline ahead of the company’s quarterly report.
This move coincided with the
relative strength index (RSI)
reclaiming the 50 threshold earlier this month, indicating a positive shift in
price momentum
.
Let’s take a closer look at Apple’s chart to identify crucial overhead areas to watch and also point out two major
support levels
that could come into play during
pullbacks
.
Crucial Overhead Areas to Watch
Amid earnings-driven buying, investors should initially keep an eye on the $260 area. The shares face a
confluence
of
resistance
in this region near the stock’s
all-time high (ATH)
and rising wedge pattern’s upper trendline.
To forecast where Apple shares may be headed upon a
breakout
above the ATH, we can apply bars pattern analysis. This technique works by taking the price bars comprising the stock’s trend higher from April to December and repositioning them from this week’s low. The study indicates a potential high of $350 before a
consolidation
phase if price action rhymes.
We selected this prior trending move as it commenced from the rising wedge’s lower trendline, similar to how the stock’s pre-earnings rally started.
Major Support Levels to Monitor During Pullbacks
During pullbacks, investors should initially keep track of the $235 level. The shares may encounter support in this area near the rising wedge pattern’s lower trendline and the upper range of a consolidation period that formed on the chart between July and October last year.
Finally, selling below this level could see Apple shares retrace to around $218, a region where buyers may look for
entry points
near the lower range of the consolidation period mentioned above, which also sits in close proximity to the rising 50-week moving average.
The comments, opinions, and analyses expressed on Investopedia are for informational purposes only. Read our
warranty and liability disclaimer
for more info.
As of the date this article was written, the author does not own any of the above securities.
Read the original article on
Investopedia
