
Watch These Apple Price Levels After Stock Suffers Biggest One-Day Drop Since August

Key Takeaways
Apple (
AAPL
) shares will be in focus on Friday after recording their largest one-day drop since early August yesterday following news that the
tech giant
lost its coveted position as China’s largest smartphone seller last year.
Data from technology research firm Canalys showed the iPhone maker’s 2024 shipments slumped 17% in the country, their largest decline since 2016, as domestic rivals Vivo and Huawei both captured additional
market share
. The company’s latest iPhones sold in China aren’t equipped with its recently launched
artificial intelligence (AI)
features due to regulatory hurdles, weighing on sales as customers turn to competitors’ devices for alternatives.
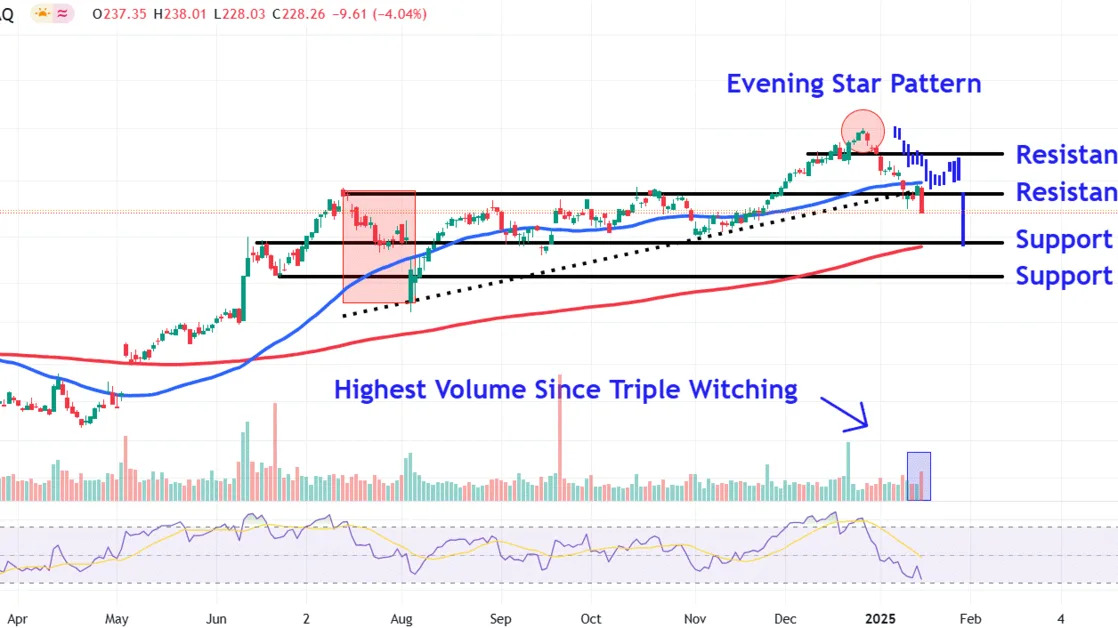
Apple shares were up 1.2% at $231 in the opening minutes of trading Friday, after falling 4% yesterday. The stock is down 9% so far in 2025, after gaining 30% last year.
Below, we take a closer look at Apple’s chart and point out important price levels worth watching after yesterday’s selling.
Ascending Triangle Breakdown
Since an
evening star pattern
marked the stock’s
all-time high (ATH)
last month, Apple shares have trended sharply lower. Selling pressure intensified on Thursday, with the price falling decisively below the lower trendline of an
ascending triangle
, raising the possibility of a significant breakdown.
It’s also worth pointing out that the stock recorded its highest
volume
yesterday since December’s
triple witching
trading session, indicating that larger market players participated in the sell-off.
Let’s apply
technical analysis
to Apple’s chart to identify crucial
support and resistance
levels that investors will likely be watching in the coming weeks.
Key Support Levels to Track
The first lower point of interest on the chart sits around $218. This location provides a
confluence
of support from a trendline that links a series of highs and lows from June to September with the upward sloping
200-day moving average
.
This location also corresponds with a bars pattern projected downside target that takes the stock’s prior major
correction
from July to August last year and overlays it from last month’s record high
The
bulls’
inability to defend this level could see Apple shares revisit lower support at the $207 level. Investors may look for buying opportunities in this area near the June 2024
pullback
low, which also closely aligns with several prices situated just above the August trough.
Important Resistance Levels to Watch
Amid a recovery in the iPhone maker’s stock, investors should watch for a potential retest of the $235 level, a location where the shares may run into resistance near the ascending triangle’s lower trendline and prominent
peaks
that formed on the chart in July and October last year.
Finally, a move back above the ascending triangle’s top trendline could see Apple shares climb to around $250. Investors who have purchased the stock at lower prices may look to book profits in this region near a brief pause in the stock’s strong
uptrend
during December.
The comments, opinions, and analyses expressed on Investopedia are for informational purposes only. Read our
warranty and liability disclaimer
for more info.
As of the date this article was written, the author does not own any of the above securities.
Read the original article on
Investopedia
