
Watch These Macy’s Price Levels as Stock Slumps on Soft Sales Guidance

Key Takeaways
Macy’s (
M
) shares could in remain in focus on Tuesday after the struggling department store said yesterday that it sees holiday quarter sales coming in
slightly below
its earlier expectations, weighed down by underperforming stores.
In February last year, the retailer announced that it plans to
close 150 stores over three years
in an effort to boost profitability by shuttering underperforming locations while focusing on expanding initiatives at its stores that generate higher sales. In a bright spot during Monday’s update, Macy’s said it remains on track to post a second quarter of sequential comparable sales improvement.
The retailer’s stock has fallen 14% since the start of the year and trades 21% lower over the past 12 months as investors continue to look for signs that its turnaround plans are translating into higher sales growth.
Below, we break down the
technicals
on Macys’ chart and point out important price levels worth watching out for.
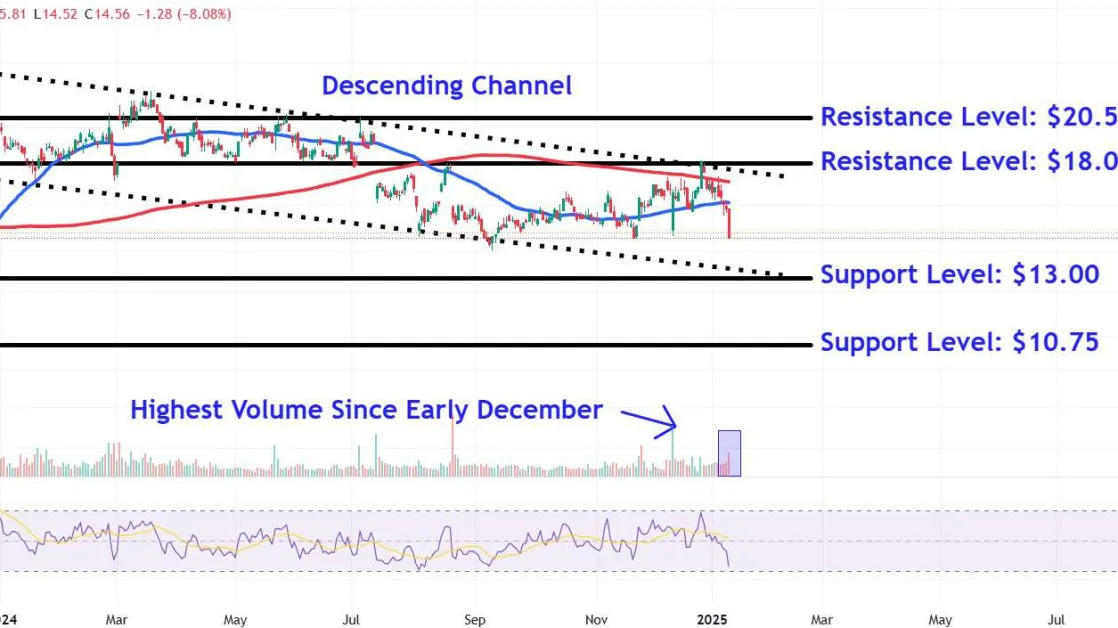
Descending Channel Remains Intact
Macy’s shares have oscillated within a 13-month
descending channel
, with the price tagging the pattern’s upper and lower trendlines on several occasions since that time.
More recently, selling has intensified after the stock ran into resistance around the formation’s upper trendline and
200-day moving average
. Importantly, yesterday’s drop occurred on the highest share
volume
since early December in a move that could trigger further short-term bearish momentum.
Let’s turn to Macy’s chart and identify several important
support and resistance
levels that will likely remain in focus.
Important Support Levels to Watch
Follow through selling from current levels could see the shares initially decline to around $13. This price level on the chart finds a
confluence
of support from the November 2023 peak and the descending channel’s lower trendline.
A convincing close below this point brings major support at $10.75 into play. Value investors may look for buying opportunities in this location near three prominent troughs that formed on the chart between September and November 2023.
Key Resistance Levels to Observe
If the stock makes a recovery, it’s worth monitoring how the price responds to the $18 level. The shares may face selling pressure in this area near the descending channel’s upper trendline, a region that also aligns with multiple
peaks and troughs
on the chart stretching back to December 2023.
A longer-tern turnaround in Macy’s shares may see the price move up to around $20.50, a level on the chart that could provide resistance near a
horizontal line
that that connects a number of peaks from December 2023 to May last year.
The comments, opinions, and analyses expressed on Investopedia are for informational purposes only. Read our
warranty and liability disclaimer
for more info.
As of the date this article was written, the author does not own any of the above securities.
Read the original article on
Investopedia
