
Watch These Palantir Price Levels as Stock Continues to Retreat From Record High

Key Takeaways
Shares in Palantir Technologies (
PLTR
) were down in premarket trading Wednesday after falling sharply yesterday, as the stock continues to retreat from its
record high
set in late December.
Recent selling in the shares comes after investment bank Morgan Stanley initiated coverage on the stock earlier this week with an “
underweight
” rating and reports surfaced that Cathie Wood’s ARK Investment Management tech funds had sold shares in the company.
The analytics software provider had a stellar 2024, ending the year as the
S&P 500’s
best performing stock. Its shares more than quadrupled, boosted by growing demand for its suit of
artificial intelligence (AI)
software products.
Palantir shares were down 2% at around $68.50 in recent premarket trading, after falling nearly 8% on Tuesday. Through yesterday’s close, the stock was down 18% from its Dec. 24 all-time high.
Below, we take a closer look at Palantir’s chart and apply
technical analysis
to identify key price levels worth watching out for.
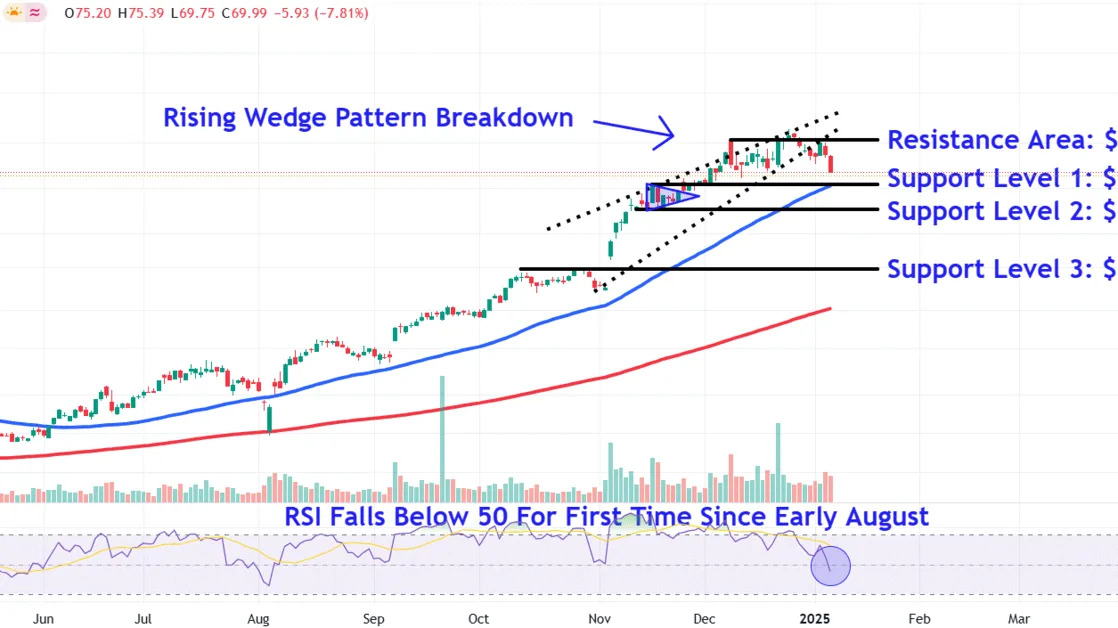
Rising Wedge Pattern Breakdown
Palantir shares broke down from a
rising wedge
in late December before retesting the pattern’s lower trendline earlier this month. However, since that time the stock has faced renewed selling pressure, though
trading volumes
remain lackluster.
Meanwhile, the
relative strength index (RSI)
confirms weaking price momentum, dropping below the key 50 threshold for the first time since early August last year.
Let’s point out three crucial
support levels
where the shares may encounter buying interest amid further selling and also identify a major
resistance
area to watch during potential upswings.
Crucial Support Levels to Watch
Firstly, investors should monitor how the stock responds to the $66 level. This location on the chart finds a trifecta of support from the mid-November
peak
, the
50-day moving average
, and the nearby 38.2%
Fibonacci retracement level
when applying a grid from the late October low to the December high.
Selling below this level could see the shares retrace to around $59, a location where investors may seek
entry points
below a
pennant pattern
that formed on the chart in mid-November.
A deeper
correction
in the stock could trigger a
gap
fill down to the $45 level, about 35% below Tuesday’s closing price. The shares would likely attract buying interest in this area near two twin peaks that emerged on the chart during October.
Major Resistance Area to Monitor
Upon a share price recovery and resumption of the longer-term
uptrend
, investors should monitor the $81 area. Rallies into this region could meet significant overhead resistance near a range of peaks positioned just below the stock’s record high.
The comments, opinions, and analyses expressed on Investopedia are for informational purposes only. Read our
warranty and liability disclaimer
for more info.
As of the date this article was written, the author does not own any of the above securities.
Read the original article on
Investopedia
