
Tesla Stock Price Levels to Watch After Volatile Stretch

Key Takeaways
Tesla (
TSLA
) shares have gained ground the past two sessions after a five-day losing streak during which the stock lost 18% of its value.
The stock hit a
record high
in mid-December amid optimism that CEO
Elon Musk’s
close ties with President-elect Donald Trump will benefit the EV maker. Tesla shares surged more than 60% in 2024, with the lion’s share of those gains coming after the November 5 election.
Tesla slumped after the Christmas break, tracking a broader market decline, and tumbled 6% on the first trading session of 2025 last Thursday when the company’s
fourth-quarter vehicle deliveries report
came in weaker than expected. The stock jumped 8% the following day as the automaker said its sales in China hit a record last year, boosting confidence that a recovery could be underway in the world’s largest car market where the company faces
intense competition
from domestic EV rivals.
Tesla shares finished Monday’s session up 0.2% at $411.05. That’s 16% below the stock’s all-time high set on December 18.
Below, we take a closer look at Tesla’s
weekly chart
and point out important price levels to watch out for.
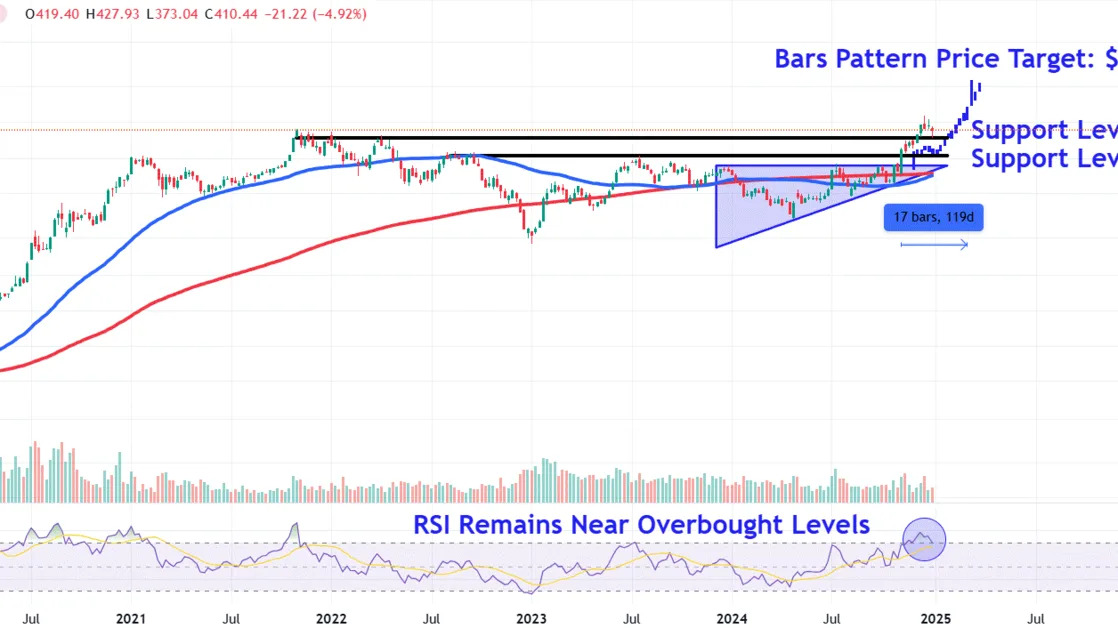
Strong Uptrend Remains Intact
Despite the recent
pullback
, Tesla shares have trended sharply higher since breaking out from an
ascending triangle
in early November following the U.S. election.
Moreover, the
relative strength index (RSI)
still gives a reading near
overbought
levels, highlighting the stock’s bullish price momentum.
Let’s apply
technical analysis
to predict how the current
uptrend
may unfold and identify important
support levels
where investors may look for buying opportunities.
Bars Pattern Analysis
To forecast a bullish
price target
and project how long the
trending
move may last before the stock
consolidates
, investors can use the bars pattern tool, which analyzes prior trends to predict future moves.
When applying the analysis to Tesla’s chart, we take the price bars that comprise the stock’s strong trend from October 2019 to February 2020 and reposition them from the November breakout. This forecasts a target of around $745 and indicates the current move higher may last until early March if price history rhymes.
We selected this prior trending move because it commenced following a weekly
breakout
of nearly 30% from a prior ascending triangle, closely mimicking the stock’s current price action.
Important Support Levels to Watch
If the stock continues to retreat from its recent highs, investors should initially keep an eye on the $370 level, a location on the chart where the shares may find support near several
peaks
positioned just below the stock’s early November 2021 top.
A close below this level could see the shares revisit lower support around $300. Investors may look to join the longer-term uptrend in this area near the
psychological round number
and a trendline that links peaks in August and July last year.
The comments, opinions, and analyses expressed on Investopedia are for informational purposes only. Read our
warranty and liability disclaimer
for more info.
As of the date this article was written, the author does not own any of the above securities.
Read the original article on
Investopedia
