
Watch these Palantir price levels after stock posts S&P 500’s biggest gains in 2024
Key Takeaways
Palantir Technologies (PLTR) is set to claim the coveted title of the
S&P 500 index’s
best performing component this year.
The company, which provides customized analytics software across various sectors, has seen its shares surge 350% since the start of the year through Monday’s close, bolstered by robust demand for its
artificial intelligence (AI)
offerings.
The software maker reported
net sales jumping 30%
in the latest quarter, with double-digit growth in both its commercial and government businesses. In the past month, the shares have gained 15% after the company secured an
army contract worth $619 million
and saw its stock
added to the tech-heavy Nasdaq 100 index
.
Palantir shares were up nearly 1% at around $78 in premarket trading Tuesday.
Below, we break down the
technicals
on Palantir’s
weekly chart
and identify key price levels to watch out for heading into the first quarter of 2025.
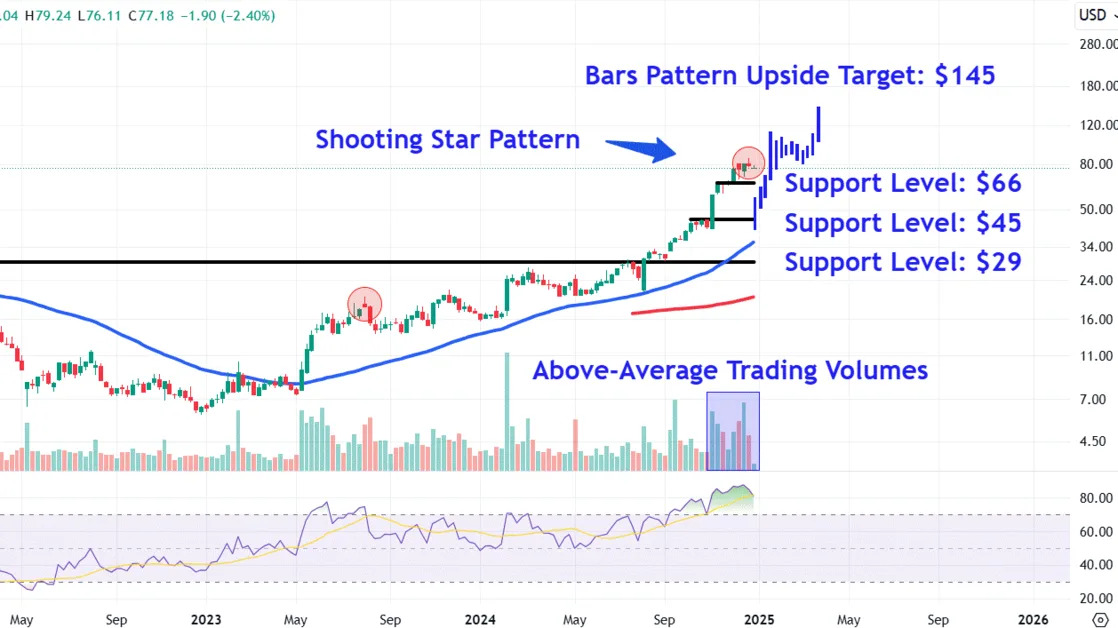
Shooting Star Indicates Potential Consolidation
Since breaking out from a month-long
consolidation
period following the presidential election in early November, Palantir shares have continued to track sharply higher on above-average
trading volumes
.
However, last week a
shooting star
formed on the chart, a
candlestick pattern
that occurs after a significant advance, indicating the price may start falling or enter a consolidation phase. It’s worth pointing out that the last time a similar pattern formed on the chart in late July, the stock fell 21% over the following two weeks.
Let’s apply
technical analysis
to identify several key
support levels
to watch if the shares undergo a retracement, but also forecast a potential upside
price target
to watch if they continue their strong move higher.
Key Support Levels to Watch
During an initial
pullback
, investors should watch the $66 level, a location on the chart where the shares may find support near a brief period of
sideways drift
that formed in mid to late November.
The
bulls
’ inability to defend this level could see the stock decline to around $45. Investors may look for buying opportunities in this area near a month-long pause in the
uptrend
that preceded a bullish wide-ranging week in early November.
A deeper
correction
in the stock could see the price fall to the $29 level. This area on the chart would likely attract strong buying interest near a multi-year trendline that may flip from a region of prior
resistance
into future support.
Upside Price Target to Monitor
If the shares continue to trend higher, investors can forecast a potential upside target by using the bars pattern tool.
To apply this to Palantir’s chart, we take the stock’s strong
trending
move from November 2020 to January 2021 and reposition it from the low of last month’s wide-ranging week. This projects a target of around $145, about 83% above Monday’s closing price. We selected this prior trending period because it commenced following a weekly gain of nearly 40%, similar to how the current impulsive move higher started in early November.
The comments, opinions, and analyses expressed on Investopedia are for informational purposes only. Read our
warranty and liability disclaimer
for more info.
As of the date this article was written, the author does not own any of the above securities.
Read the original article on
Investopedia
