
Watch These Apple Stock Price Levels as $4T Market Cap Remains in Striking Distance

Key Takeaways
Apple (
AAPL
) shares moved lower Monday morning, tracking a broader decline for U.S. stocks, but the company remains in striking distance of becoming the first ever to reach a $4 trillion
market capitalization
.
Last Thursday, the company set a fresh record high just above $260 after Wedbush analysts led by Apple bull Dan Ives said that
artificial intelligence (AI)
demand sets the tech giant up for a “
golden era of growth
” in 2025. This week, investors will be watching if Apple shares can hit $264.62, the price need to reach a $4 trillion market cap.
The company first unveiled its AI-software marketed as Apple Intelligence back in June, but the rollout has been slow, with investors watching if a major upgrade cycle to access the features drives 2025 sales.
Apple shares were down 1.2% at $252.50 in midday trading Monday. Since the start of the year, Apple shares have gained around 31%, handily outpacing the
S&P 500’s
24% increase over the same period.
Below, we take a closer look at Apple’s chart and apply
technical analysis
to identify several important price levels that investors may be watching.
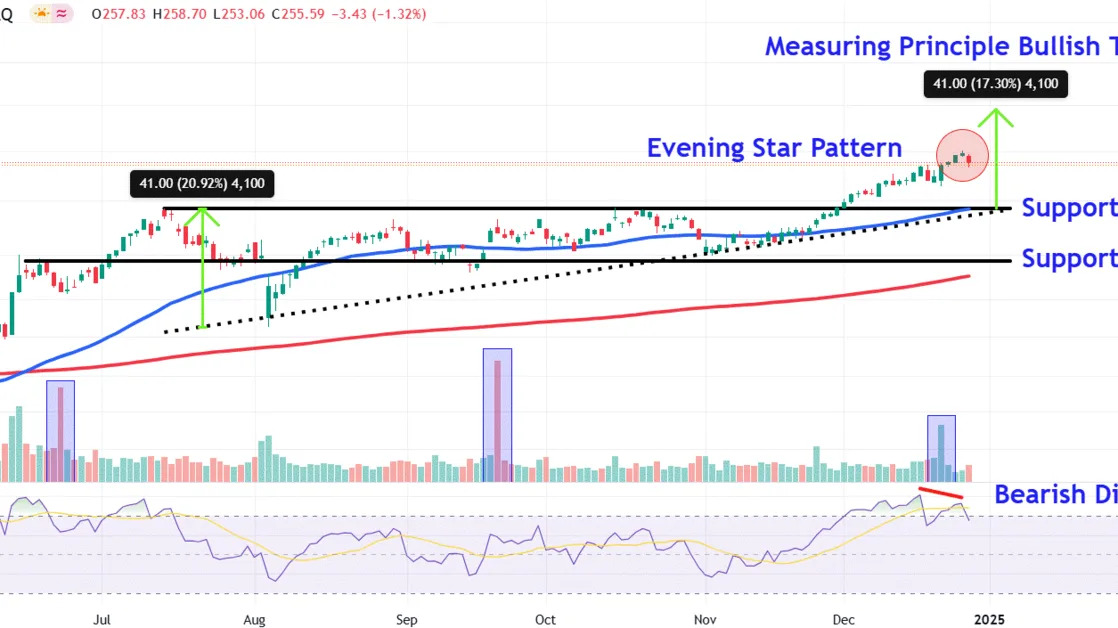
Evening Star Pattern Emerges
Apple shares have trended higher since breaking out above a broad
ascending triangle
formation earlier this month. However, a bearish
evening star pattern
has formed on the iPhone maker’s chart over the past three trading sessions, indicating a potential reversal.
Moreover, as the stock climbed to a record high last week, the
relative strength index (RSI)
made a comparatively shallower high to create a bearish
divergence
, a technical signal pointing to weakening price momentum.
It’s also worth noting
volume
spikes in the stock on June 21, Sept. 20, and Dec. 20, with these dates coinciding with
triple witching
days, suggesting portfolio
rebalancing
by larger market participants, such as
institutional investors
and hedge funds.
Let’s identify key
support levels
to watch if the stock undergoes a reversal, but also forecast a bullish
price target
to monitor if the shares continue their longer-term uptrend.
Key Support Levels to Watch
The first level to eye sits around $237. This location on the chart could attract buying interest near the
50-day moving average
and the ascending triangle’s top trendline, an area that may flip from prior
resistance
into future support.
A decisive close below this area could see Apple shares retrace to the $218 level, a region where investors may look for
entry points
near a trendline that links a range of comparable
price action
on the chart between June and September.
Bullish Price Target to Monitor
Investors can forecast a bullish price target by using the
measuring principle
, a technique that analyzes prior chart patterns to projects potential future moves.
To apply the tool to Apple’s chart, we calculate the distance between the ascending triangle’s two trendlines near their widest point and add that amount to the initial
breakout
area. For instance, we add $41 to $237, which forecasts a target of $278, a location where technical traders may look for
exit points
.
The comments, opinions, and analyses expressed on Investopedia are for informational purposes only. Read our
warranty and liability disclaimer
for more info.
As of the date this article was written, the author does not own any of the above securities.
Read the original article on
Investopedia
