
Watch These Nike Stock Price Levels as Strategy Shift Weighs on Outlook

Key Takeaways
Nike (
NKE
) shares lost ground Friday morning after the sports equipment and apparel reported quarterly results that
topped Wall Street’s estimates
but provided an outlook that came in below expectations, as the company undergoes an ambitious strategy shift.
The company anticipates current quarter
revenue
to contract by low double digits from a year earlier. CEO Elliott Hill, who assumed the role in October, said on Nike’s
earnings call
late Thursday that the company plans to refocus on sports and selling more items at premium prices, but cautioned that the turnaround will take time and weigh on short-term results.
Nike shares have lost nearly 30% of their value since the start of the year amid intensifying competition in both domestic and international markets that has eroded its
market share
. The stock was down slightly at $77 in midday trading Friday, after falling below $75 early in the session.
Below, we break down the
technicals
on Nike’s
weekly chart
to identify key post-earnings price levels investors may be watching.
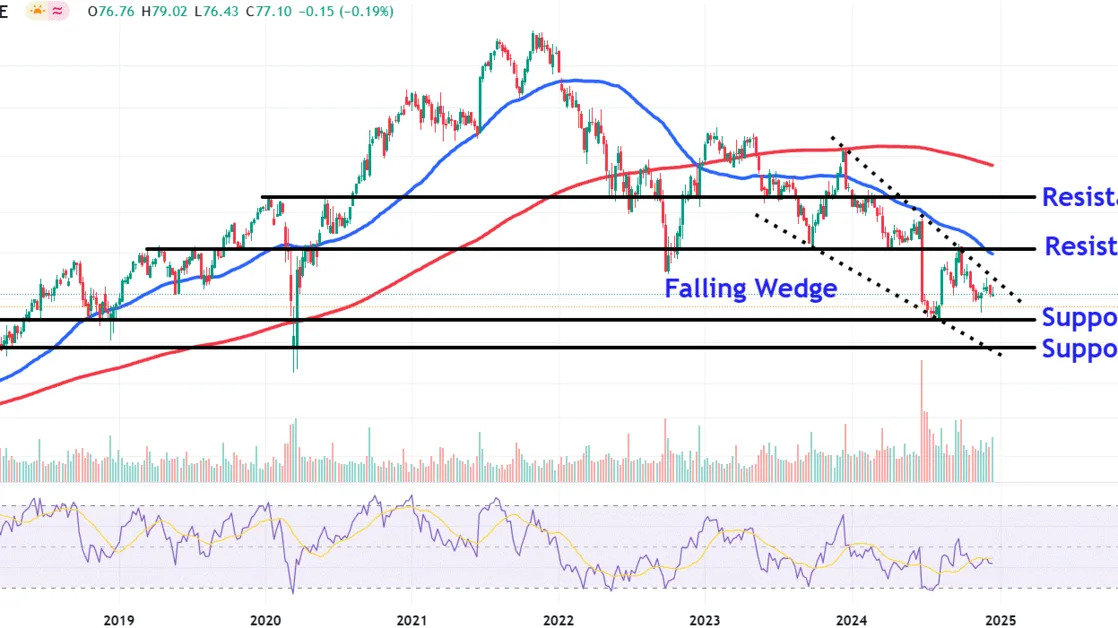
Falling Wedge Pattern in Focus
Nike share have traded within a 15-month
falling wedge
, a chart pattern consisting of two converging downward sloping trendlines that often precedes an upward
breakout
.
More recently, the stock has
consolidated
just below the formation’s upper trendline, signaling indecision ahead of the company’s quarterly report.
Let’s take a closer look at Nike’s chart to identify major
support and resistance
levels that may attract further attention.
Major Support Levels to Watch
Selling below current levels could see the shares fall to around $71, a location on the chart where they may encounter support near a
horizontal line
that joins a range of similar price points on the chart between February 2018 and July this year.
A
breakdown
below this important technical area opens the door for a drop to long-term support at the $65 level. Investors could seek bargain hunting opportunities in this region near a consolidation period that formed on the chart in late 2017 and early 2018, which also aligns with the opening prices of several
wide-ranging days
that marked the March 2020 pandemic low.
Key Resistance Levels to Observe
A breakout above the falling wedge pattern’s upper trendline could propel a move to around $89. This area finds a
confluence
of resistance from a multi-month trendline that connects multiple
peaks
and troughs on the chart from March 2019 to September this year with the nearby 50-week moving average.
Further upside may see the shares rally to the $105 level. Investors who purchased the stock at lower prices may look for
exit points
near a trendline that links the January and June 2020 peaks with a range of comparable
price action
on the chart between May 2022 and February this year.
The comments, opinions, and analyses expressed on Investopedia are for informational purposes only. Read our
warranty and liability disclaimer
for more info.
As of the date this article was written, the author does not own any of the above securities.
Read the original article on
Investopedia
