
Watch These Broadcom Price Levels as Stock Soars on Strong AI Sales Growth

Key Takeaways
Broadcom (
AVGO
) shares surged in extended trading Thursday after the
chipmaker reported
better-than-expected earnings and issued a rosy outlook amid robust AI-driven sales growth.
The company said its fiscal 2024 AI
revenue
more than tripled, driven by its AI XPUs and Ethernet networking portfolio. After-hours gains accelerated after CEO Hock Tan told analysts on the company’s
earnings call
that he anticipates significant AI opportunities over the next three years, adding that he sees accelerators and networking sales in fiscal 2027 ranging between $60 billion and $90 billion.
Through Thursday’s close, Broadcom shares had gained 64% since the start of the year. The stock rose 14% to around $206 in extended trading.
Below, we break down the
technicals
on Broadcom’s
weekly chart
and identify key price levels worth watching out for.
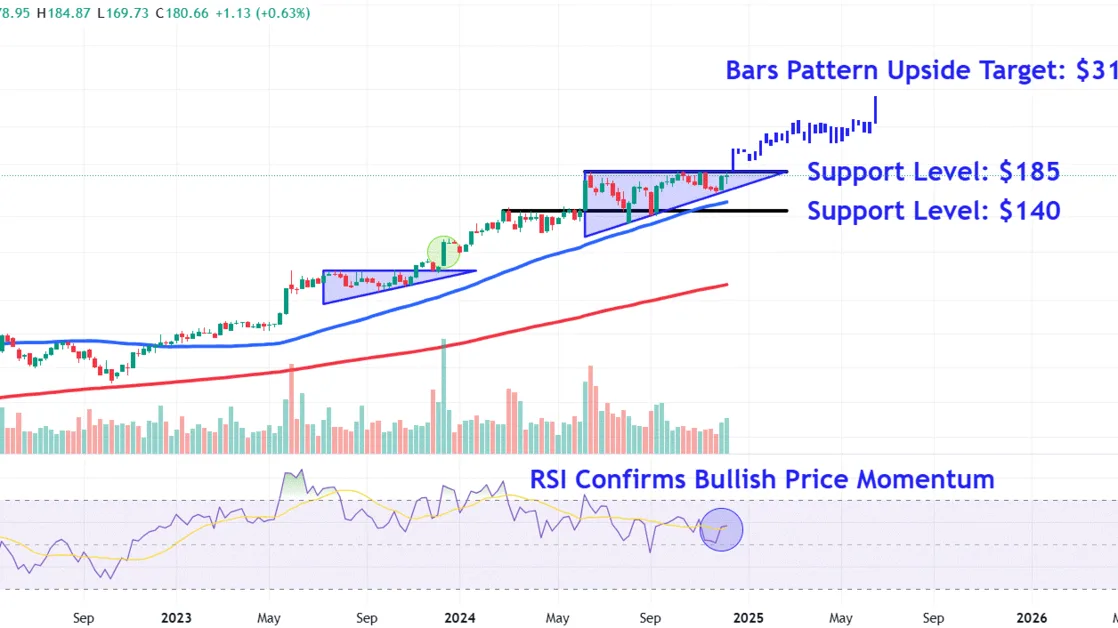
Ascending Triangle Breakout
Broadcom shares have consolidated within an
ascending triangle
since mid June, a chart pattern that signals a
continuation
of the stock’s longer-term uptrend.
Indeed, the price sits poised to break out above the formation’s top
trendline
on Friday, setting the stage for further upside.
Moreover, the
relative strength index (RSI)
gives a reading just above 50, confirming bullish momentum and indicating the shares have ample room to test higher prices as they move into
price discovery
.
Let’s apply
technical analysis
to forecast a potential upside
price target
and also identify two key
support levels
that would likely attract buying interest during retracements.
Bars Pattern Upside Price Target
To forecast an upside target in the stock, investors can use the bars pattern tool, which analyzes prior
trends
to help predict future directional moves.
When applying the tool to Broadcom’s chart, we extract the stock’s trend higher from December 2023 to June this year and reposition it from the ascending triangle’s top trendline. This projects a longer-term upside target of around $315.
We selected this prior move as it commenced following a decisive earnings-driven jump above a continuation pattern on the chart in December last year, similar price action to what looks likely after the company’s latest quarterly report.
Key Support Levels to Watch During Pullbacks
During
pullbacks
, investors should initially watch how the price reacts to the $185 level. This location on the chart would likely attract buying interest near the ascending triangle’s top trendline, which may flip from an area of prior
resistance
into future support.
Selling below this level could see Broadcom shares revisit lower support around $140, an area where investors may seek buying opportunities near a
horizontal line
that connects a series of comparable trading activity on the chart between February and September.
The comments, opinions, and analyses expressed on Investopedia are for informational purposes only. Read our
warranty and liability disclaimer
for more info.
As of the date this article was written, the author does not own any of the above securities.
Read the original article on
Investopedia
