
Watch These Adobe Price Levels as Stock Slides After Disappointing Revenue Outlook

Key Takeaways
Adobe (
ADBE
) shares fell sharply in premarket trading on Thursday after the multimedia software provider issued a
revenue outlook
that fell short of Wall Street expectations.
The company guided current-quarter net sales of between $5.63 billion and $5.68 billion, while saying it sees fiscal 2025 revenue of $23.3 billion to $23.6 billion, both short of consensus estimates, which analysts had pegged at $5.72 billion and $23.8 billion, respectively.
Through Wednesday’s close, Adobe shares had fallen 8% since the start of the year. The stock has been weighed down, in part, by concerns that the company’s integration and monetization of
artificial intelligence (AI)
into its suite of product offerings has not yet meaningfully contributed to the company’s
top line
growth.
Adobe shares were down 11% at $488.75 in recent premarket trading.
Below, we break down the
technicals
on Adobe’s chart and point out key price levels to watch out for.
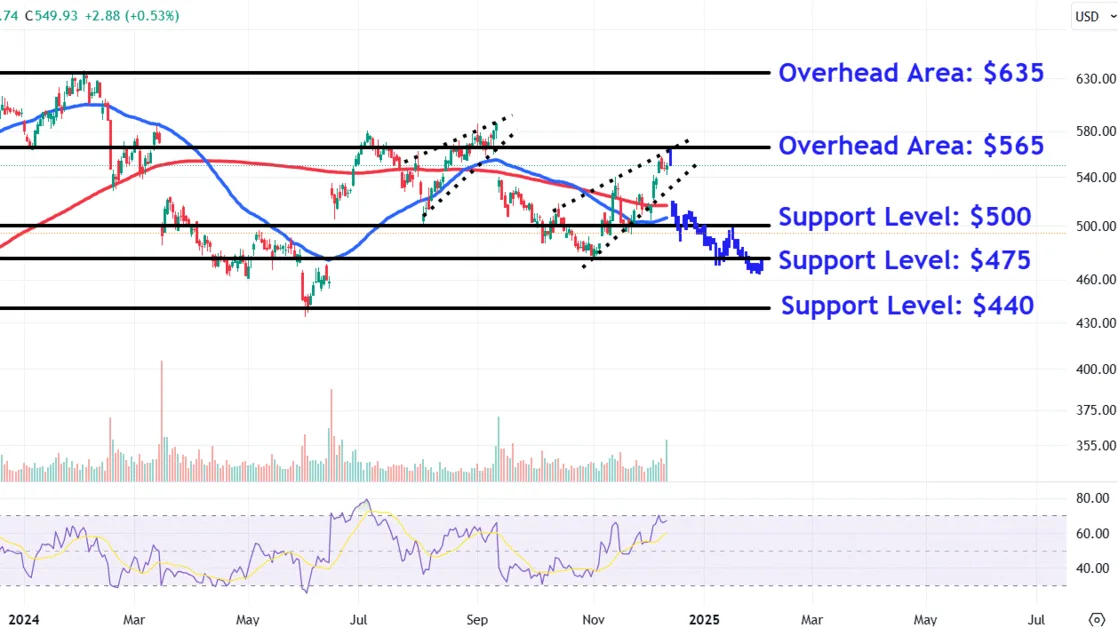
Rising Wedge Breakdown
Since mid-October, Adobe shares have traded higher within a
rising wedge
, mimicking a similar pattern that formed on the chart between July and September.
Interestingly, an earnings
gap
breakdown followed the earlier formation, similar to what looks likely to happen after the company’s latest quarterly results.
Let’s identify three crucial
support levels
where Adobe shares may encounter buying interest and also discuss important overhead areas to watch if the stock makes a bullish
reversal
.
Crucial Support Levels to Monitor
Firstly, it’s worth monitoring the $500 level. This location could provide support near a
trendline
that links the prominent September 2023
swing low
and a range of comparable trading activity between March and November.
Selling below this level could see the shares decline to around $475, a region on the chart where investors may seek
entry points
near the stock’s June 2023
pullback
low and early November 2024 trough. This area also roughly aligns with a bars pattern projection that extracts the
downtrend
that followed the earlier wedge formation and repositions it from the top trendline of the current rising wedge.
A deeper
correction
in the stock may lead to a retest of lower support near $440. Bargain hunters could look to accumulate shares in this area around a
consolidation
period in June 2023, which closely lines up with the June 2024 swing low.
Important Overhead Areas to Watch
Upon a share price recovery, investors should initially keep track of the $565 area. This key overhead level could provide selling pressure near a
horizontal line
that connects the rising wedge pattern’s top trendline with multiple
peaks and troughs
on the chart dating back to September last year.
Further upside could see a rally to around $635, a location where Adobe shares would likely run into
resistance
near two peaks that formed a
double top
on the chart between December 2023 and February.
The comments, opinions, and analyses expressed on Investopedia are for informational purposes only. Read our
warranty and liability disclaimer
for more info.
As of the date this article was written, the author does not own any of the above securities.
Read the original article on
Investopedia
