
Watch These Apple Price Levels After Stock Set a New Record High

Key Takeaways
Apple (
AAPL
) shares could remain on
watchlists
Tuesday after setting a new
all-time high (ATH)
yesterday and registering their 21st record close of the year.
Sentiment surrounding the stock may have received a boost after Melius Research analyst Ben Reitzes told
CNBC’s “Squawk on the Street
” in a recent interview that the iPhone maker sits well positioned to benefit from a multi-year cycle of product launches, adding that the company’s integration with OpenAI’s
ChatGPT
provides potential
revenue
opportunities through pro-version upgrades.
Apple shares traded
sideways
for most of the third quarter as investors digested the delayed rollout of the tech giant’s highly anticipated
Apple Intelligence features
and its impact on device sales. However, the stock has regained its upward trajectory, rallying more than 12% from its early November low and trading 28% higher since the start of the year as of Monday’s close.
Below a take a closer look at the
technicals
on Apple’s chart and identify key price levels that investors may be watching out for.
Ascending Triangle Signals Bullish Continuation
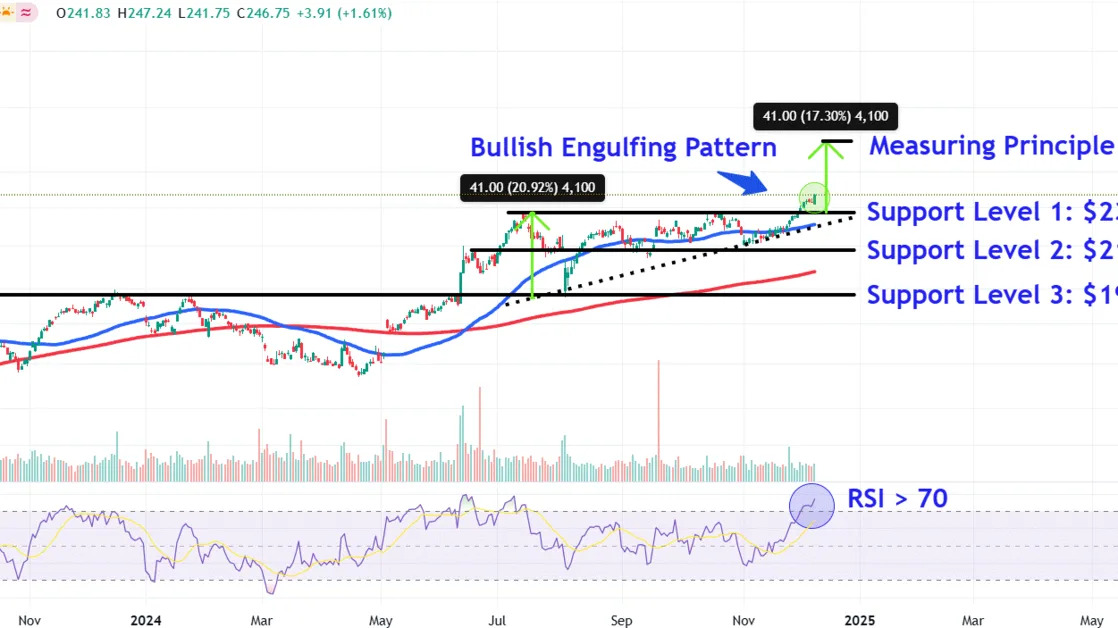
Apple shares broke out from a five-month
ascending triangle
earlier this month, signaling a
continuation
of the stock’s longer-term uptrend.
The stock has continued to move higher, albeit on lackluster
volume
, with the price completing a
bullish engulfing pattern
as it set a fresh record high in Monday’s trading session.
While the
relative strength index (RSI)
confirms bullish price momentum, the indicator also flashes
overbought
conditions that could lead to near-term profit taking.
Let’s apply technical analysis to project where the stock’s price may be headed next if the current continuation move plays out and also identify three key
support levels
that could attract buying interest during
retracements
.
Chart-Based Price Target to Watch
Investors can project a potential bullish
price target
by using the
measuring principle
, a technique that analyses
chart patterns
to predict future moves.
When applying the tool to Apple’s chart, we calculate the depth of the ascending triangle near its widest section and add that amount to the pattern’s top
trendline
.
In this case, we add $41 to $237, which forecasts an upside price target of $278, about 13% above Monday’s closing price.
Key Support Levels to Monitor
Upon an initial dip, investors should watch how the price responds to the $237 level. The stock may find buying interest in this area near the ascending triangle’s top trendline, which may flip from a location of prior
resistance
into future support.
The
bulls’
failure to defend this area could see the shares decline to around $218, a price where they may attract support near the June
peak
, which closely aligns with troughs in July, September, and November.
Finally, a deeper
correction
in Apple shares may lead to a retest of long-term support near $197. Investors would likely look for
buy-and-hold
opportunities in this area around a multi-month trendline that connects a range of comparable trading levels on the chart from July 2023 to August this year.
The comments, opinions, and analyses expressed on Investopedia are for informational purposes only. Read our
warranty and liability disclaimer
for more info.
As of the date this article was written, the author does not own any of the above securities.
Read the original article on
Investopedia
