
Watch These Super Micro Price Levels as Stock Jumps After Nasdaq Filing Extension

Key Takeaways
Super Micro Computer (
SMCI
) shares traded higher in early trading on Monday after the embattled server maker said late Friday that it had received an
extension
until February from the
Nasdaq
to file its delayed annual report.
The news comes almost a month after the company named a new auditor and
submitted a compliance plan
to the exchange as concerns grew that its stock could be delisted after the firm failed to file its 2024 annual report in August following a series of
accounting
and corporate governance issues.
Supermicro said Friday that it anticipates filing its annual report, along with its delayed report for the September quarter, by the Feb. 25 deadline to meet its Nasdaq exchange
listing requirements
.
Although the stock dropped around 65% between late October and mid-November, it has recovered most of those losses over the past month and now trades more than 50% higher on the year through Friday’s close.
Below, we take a closer look at Supermicro’s chart and use
technical analysis
to identify important price levels that investors may be watching out for.
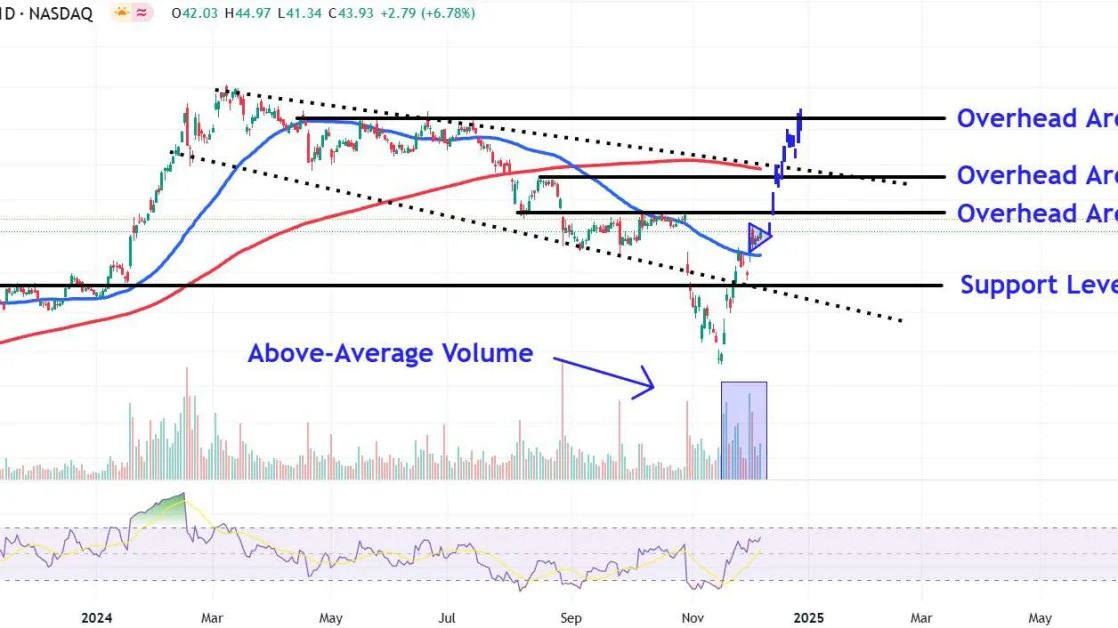
Pennant Pattern Signals Bullish Continuation
Since bottoming out last month, Supermicro shares have staged a remarkable recovery, with the price more than doubling from its mid-November low.
Importantly, above-average
volume
has backed the bullish
reversal
, indicating buying activity from larger market players.
More recently, the stock consolidated within a pennant last week, a chart pattern that signals a
continuation
of the stock’s recent impulsive move higher.
Let’s point out three key overhead areas on Supermicro’s chart worth watching and also identify a major
support level
that may attract buying interest in the stock during
pullbacks
.
Key Overhead Areas Worth Watching
The first overhead area to monitor sits around $50. This level, about 14% above Friday’s closing price, could encounter selling pressure near the early August
swing low
and the upper level of a narrow
consolidation
period that formed on the chart throughout most of October.
A close above this price could see the shares climb to the $64 level, an area on the chart just below the downward sloping
200-day moving average
where the price may run into
resistance
near the prominent August countertrend high.
Further upside may lead to a
breakout
above the top trendline of a longstanding descending
broadening formation
and subsequent move up to around $97. Investors may look for selling opportunities in this region near several
peaks
that emerged on the chart between April and July.
Interestingly, this area also roughly aligns with a bars pattern
price target
that extracts the stock’s impulsive move higher that preceded the pennant and repositions it from the pattern’s upper trendline.
Major Support Level That May Attract Buying Interest
A wave of selling in the stock could see the shares revisit lower support near $30. Investors who are waiting for a retracement may seek
entry points
near a multi-month trendline that connects a range of similar trading levels on the chart from August 2023 to November this year.
The shares could also find support in this area from the descending broadening formation’s lower trendline, depending on the timing of such a move lower.
The comments, opinions, and analyses expressed on Investopedia are for informational purposes only. Read our
warranty and liability disclaimer
for more info.
As of the date this article was written, the author does not own any of the above securities.
Read the original article on
Investopedia
