
Lululemon Price Levels to Watch as Stock Soars on Strong Earnings, Outlook

Key Takeaways
Lululemon Athletica (
LULU
) shares soared on Friday after the activewear retailer reported
fiscal third-quarter results that topped analysts’ estimates
and raised its full-year outlook.
The company guided fiscal 2024
revenue
of between $10.45 billion and $10.49 billion, an improvement from its earlier projection of $10.38 billion to $10.48 billion. While revenue in the company’s Americas market grew by just 2% in the third quarter from the prior year, it jumped 33% in the retailer’s international business, boosted by strength in China.
Lululemon shares were up 18% at $407 in midday trading Friday, leading gainers in the S&P 500 and Nasdaq Composite. Even with today’s gain, the stock has lost about a fifth of its value since the start of the year due, in part, to problems associated with
the company’s product assortment
.
Below, we take a closer look at Lululemon’s chart and use
technical analysis
to point out important price levels worth watching out for.
Inverse Head and Shoulders Breakout
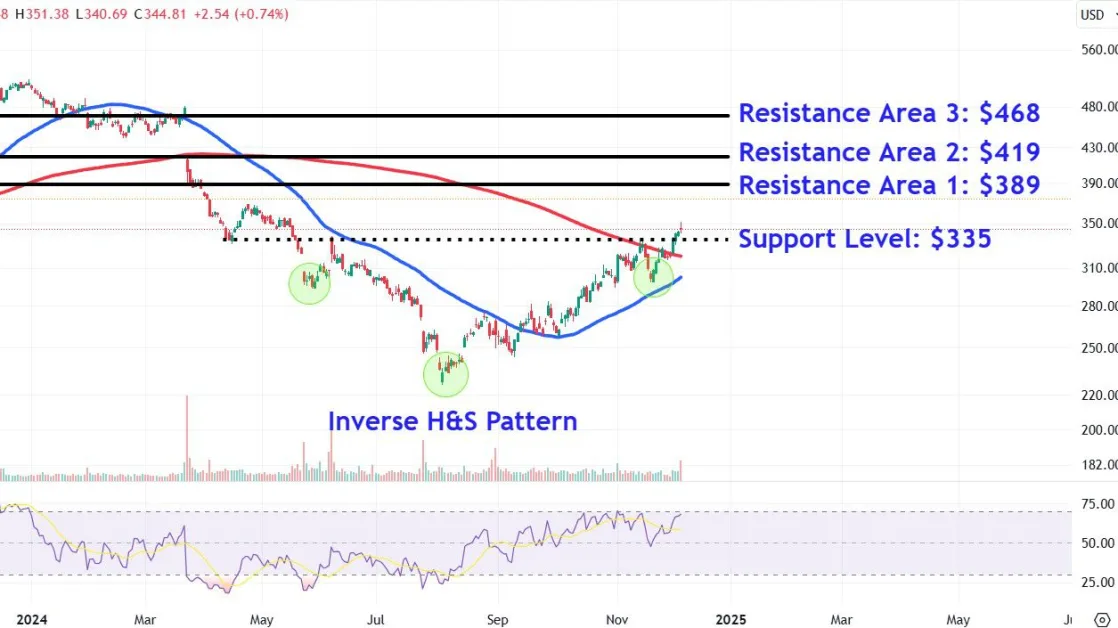
Lululemon shares formed an
inverse head and shoulders
between May and November before breaking out above the pattern’s
neckline
earlier this week ahead of the company’s quarterly report.
Moreover, the
50-day moving average (MA)
has turned upwards toward the 200-day MA, setting the stage for a potential
golden cross
—a bullish chart signal that indicates the start of a new uptrend.
Let’s identify three important overhead
resistance
areas where the shares may encounter selling pressure and also highlight a key
support level
where investors could look for buying opportunities during a
pullback
.
Important Resistance Areas to Watch
Investors should watch how the price responds to the $389 area. The shares could find resistance in this region near a
horizontal line
that joins multiple
peaks and a trough
on the chart between May and October last year.
A decisive close above this area could see the shares make a move toward $419, a location where investors may look to place sell orders near the October 2023 peak and the high price of a
gap
down
candlestick
that appeared on the chart in March.
Further bullish
price action
could drive a rally up to around $468. This area may attract selling pressure near a trendline that connects a range of similar trading levels on the chart from December last year to March.
Key Support Level to Monitor
During periods of
profit-taking
, it’s worth monitoring the $335 level. Investors may look for buying opportunities in this location near the prominent April
swing low
, which also forms the neckline of the inverse head and shoulders pattern.
The comments, opinions, and analyses expressed on Investopedia are for informational purposes only. Read our
warranty and liability disclaimer
for more info.
As of the date this article was written, the author does not own any of the above securities.
Read the original article on
Investopedia
