
Watch These Amazon Price Levels as Stock Hits New Record High

Key Takeaways
Amazon (
AMZN
) shares hit another record high Thursday, bucking the broader
market’s downturn today
and boosting their year-to-date gain to 45%.
On Tuesday, the tech giant said it’s
building a supercomputer using its in-house Trainium chips
, which will be be used by
artificial intelligence (AI)
start-up Anthropic. According to a report in
The
Wall Street Journal
, the move positions the company to take on AI favorite Nvidia (
NVDA
) in the lucrative
graphics processing unit (GPU)
chip market.
Separately this week, the
e-commerce titan
reported
record sales and number of items sold at the start of the holiday shopping season
, with the company saying the majority of sales came from independent sellers.
Amazon’s gains so far in 2024 have handily outpaced the
S&P 500’s
return of about 27% over the period. The stock rose 1.1% to $220.55 on Thursday.
Below, we analyze the
technicals
on Amazon’s chart and point out key price levels that investors may be watching out for.
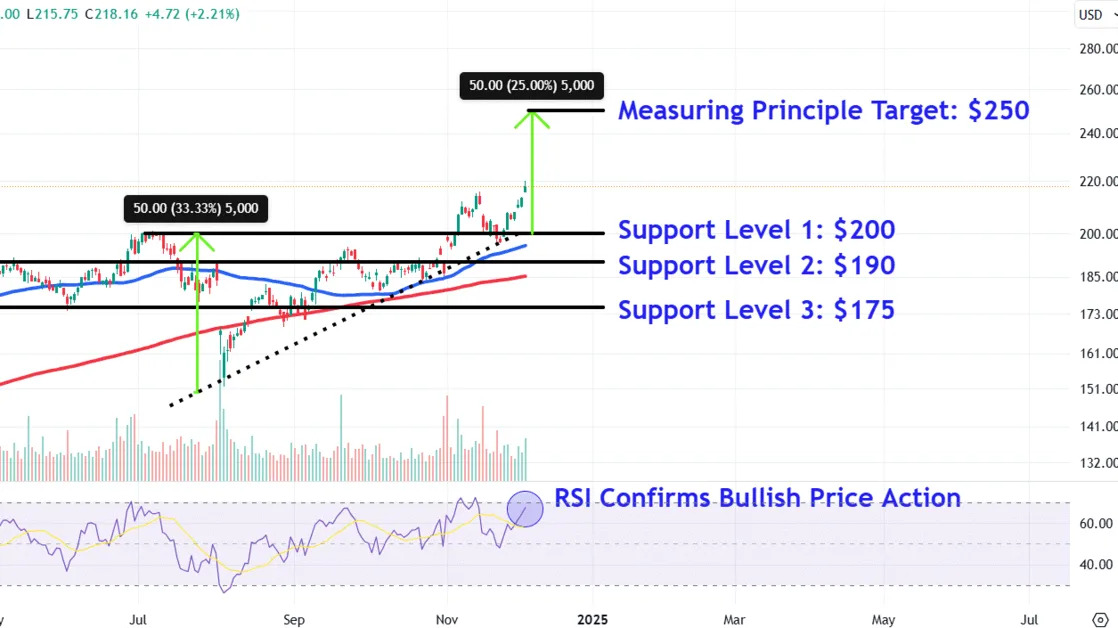
Ascending Triangle Retest
After breaking out from an
ascending triangle
last month, Amazon shares retested the initial breakout area before moving higher, signaling a
continuation
of the stock’s longer-term uptrend.
Meanwhile, the
relative strength index (RSI)
confirms bullish
price action
with a reading above 60, though the indicator still sits below overbought levels, providing the stock with room for further upside before
consolidating
.
Let’s turn to Amazon’s chart to predict a potential
price target
and identify three major
support levels
that may attract buying interest during
pullbacks
in the stock.
Upside Price Target to Watch
Investors can forecast an upside target using the
measuring principle
, a technique that analyzes prior price moves to project future moves.
To apply the tool to Amazon’s chart, we measure the distance between the ascending triangle’s two
trendlines
near their widest point and add that amount to the pattern’s breakout area. Therefore, we add $50 to $200, which projects a target of $250, a chart location where investors may decide to
lock in profits
.
Monitor These Major Support Levels
The first lower level to monitor sits around $200. A second retest of this area would likely find buying interest near the ascending triangle’s top trendline, which may turn into a price floor.
A decisive close below this important level could see the shares slip to around $190, an area where they may encounter support near a trendline that connects multiple
peaks
that formed on the chart between April and October.
Finally, a more significant downside move may trigger a fall to the $175 level. Investors could seek to accumulate
buy-and-hold
positions in this area near a multi-month
horizontal line
that joins a range of comparable trading levels on the chart from February to September.
The comments, opinions, and analyses expressed on Investopedia are for informational purposes only. Read our
warranty and liability disclaimer
for more info.
As of the date this article was written, the author does not own any of the above securities.
Read the original article on
Investopedia
