
Marvell Technology Price Levels to Watch as Stock Soars After Strong Earnings

Key Takeaways
Marvell Technology (
MRVL
) jumped in premarket trading Wednesday after the chipmaker posted strong quarterly results and issued a rosy outlook amid robust demand for its custom AI chips.
The company guided fourth-quarter
revenue
of $1.80 billion, plus or minus 5%, handily surpassing the consensus forecast of $1.65 billion. Earlier this year, the chipmaker said it expects AI network and custom processor chip sales to reach $2.5 billion by fiscal 2026, a forecast CEO Matthew Murphy said on Tuesday’s
earnings call
that the company was overshooting.
Marvell shares were up more than 13% at around $109 in recent premarket trading. Through Tuesday’s close the stock had gained nearly 60% since the start of the year, boosted for insatiable demand for advanced chips that can power the complex processing requirements of generative AI.
Below, we break down the
technicals
on Marvell’s chart and point out important price levels worth watching out for.
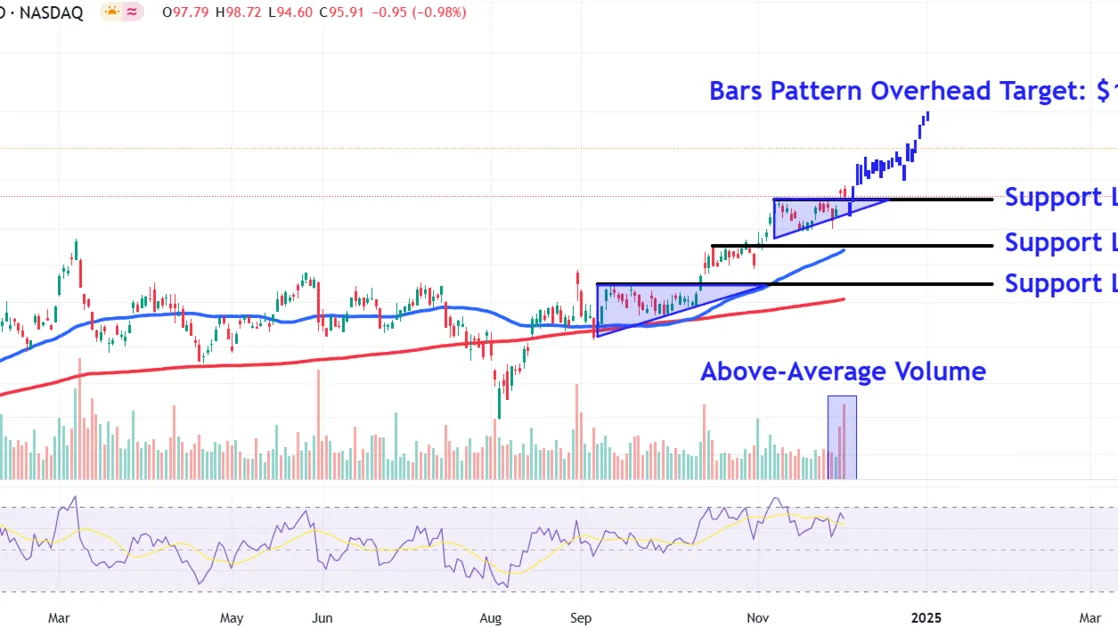
Ascending Triangle Breakout
Marvell shares broke out from an
ascending triangle
on above-average
volume
Monday, a bullish chart pattern that indicates a
continuation
of the stock’s uptrend.
Let’s use
technical analysis
to speculate an overhead
price target
and also identify several important
support levels
that investors may monitor during retracements.
Bars Pattern Overhead Target to Watch
Investors can forecast an overhead target using a bars pattern, a technique that analyzes prior price bars on the chart to predict future moves.
To apply the tool to Marvell’s chart, we take the price bars from the stock’s
trending
move between October and November and reposition them from the ascending triangle’s lower
trendline
. This predicts an overhead target of around $120, about 25% above Tuesday’s closing price.
We selected this prior trend as it began from the lower trendline of an earlier ascending triangle on the chart, similar to how the current move higher has started.
Important Support Levels to Monitor
The first lower level to monitor sits around $95, an area on the chart that could provide support upon a
pullback
to the ascending triangle’s upper trendline.
Selling below this level could see the shares fall to the $84 level. Investors may seek buying opportunities in this region near the upward sloping
50-day moving average
and a period of
consolidation
in late October.
Finally, a more
bearish
move opens the door for a retest of lower support near $76. This area on the chart would likely attract buying interest around the earlier ascending triangle’s top trendline, which also sits in close proximity to several prominent
peaks
that have formed on the chart this year.
The comments, opinions, and analyses expressed on Investopedia are for informational purposes only. Read our
warranty and liability disclaimer
for more info.
As of the date this article was written, the author does not own any of the above securities.
Read the original article on
Investopedia
