
Watch These GE Vernova Price Levels as Stock Trading Near Record High

Key Takeaways
GE Vernova (
GEV
) shares will likely remain on
watchlists
Wednesday after jumping more than 3% yesterday to
set a new record high
following favorable coverage from leading investment banks.
Analysts at Barclays initiated their coverage of the stock with an ”
overweight
” rating and
price target
of $250, while Bank of America analysts upgraded GE Vernova to a ”
buy
” rating and raised their price target to $300 from $200.
The banks argue that the stock remains undervalued compared to multi-industry peers due to the global energy giant’s greater exposure to the gas and electrification sectors, which sit poised for growth as demand for
artificial intelligence (AI)
data centers and electric vehicle (EV) charging infrastructure accelerates in coming years.
The stock has gained 69% since being
spun off
from GE Aerospace (
GE
) on April 2 as part of a larger breakup of the
General Electric conglomerate
. Shares have gained 18% since the start of September.
Below, we’ll take a closer look at the
technicals
on GE Vernova’s chart and identify key price levels that market participants will likely be watching.
RSI Indicates Short-Term Overbought Conditions
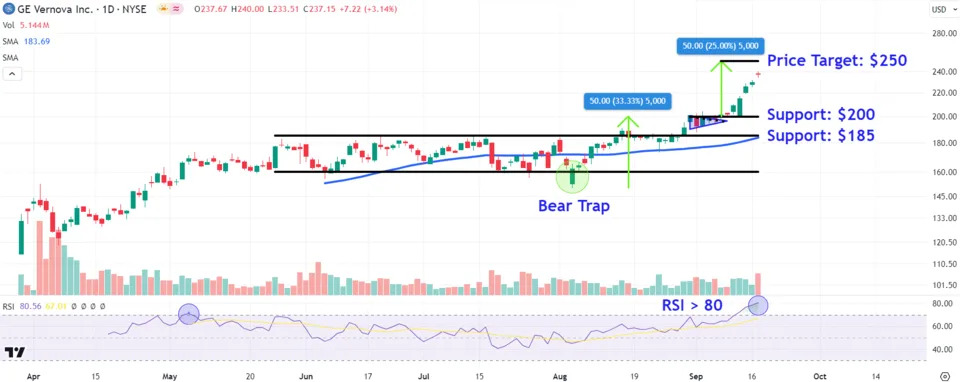
GE Vernova shares trended higher for two months after they started trading before moving into a
trading range
between late May and early August.
Bullish price momentum resumed last month when the stock initially broke down below the range’s lower trendline, but promptly reversed course to create a
bear trap
. Since that time, the stock has continued its longer-term uptrend, with gains recently accelerating following a
breakout
from a
pennant
, a chart pattern that indicates upside continuation.
However. Investors should be mindful of a potential short-term
retracement
, given the
relative strength index (RSI)
points to extremely
overbought
conditions in the stock with a reading above the 80 threshold. Last time the indicator flashed overbought conditions in early May, the price traded sideways for several weeks before completing its trending move later that month.
GE Vernova shares were up fractionally at $237.30 in recent premarket trading Wednesday.
Retracement Levels to Watch
During periods of weakness in the stock, investors should monitor two key chart levels.
The first sits at $200, an area on the chart where the shares would likely find
support
from the
psychological round number
and the top of the pennant pattern that formed earlier this month within the stock’s uptrend.
A failure to hold this level could see the stock retest the $185 region, where it finds a
confluence
of support from prior trading range’s upper trendline and the upward sloping
50-day moving average (MA)
.
Upside Price Target to Monitor
If the shares continue to trend higher, we can use the
measuring principle
to project an upside price target. To do this, we calculate the distance of the trending move that preceded the pennant and add that amount to the pattern’s breakout point. In this case, we add $50 to $200, which forecasts a target of $250.
The comments, opinions, and analyses expressed on Investopedia are for informational purposes only. Read our
warranty and liability disclaimer
for more info.
As of the date this article was written, the author does not own any of the above securities.
Read the original article on
Investopedia
.
