
Watch These Albemarle Price Levels After Stock’s Big Jump
The Lithium Producer’s Shares Rose More Than 13% on Wednesday

Key Takeaways
Shares in lithium producer Albemarle (
ALB
) will likely remain in focus on Thursday after jumping more than 13% yesterday following news that Chinese battery producer CATL plans to
reduce lithium production
at one of its large mines, a move that could balance the metal’s supply-and-demand dynamics.
The stock, which has lost more than half its value over the past year, continues to come under pressure from falling lithium prices amid an uncertain outlook for
electric vehicles (EVs)
, whose batteries act as a key demand driver for the metal.
Let’s take a closer look at Albemarle’s chart and use
technical analysis
to identify important price levels worth watching.
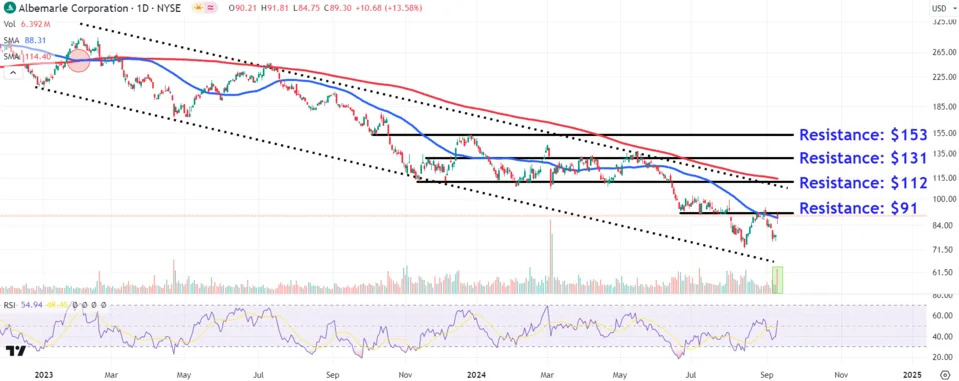
Technicals Points to Potential Trend Reversal
Albemarle shares have trended lower within a
descending channel
since the 50-day moving average (MA) crossed below the 200-day MA in February last year to form an ominous
death cross
pattern.
Although the stock mined a fresh multi-year low in August, the
relative strength index (RSI)
indicator made a comparatively shallower low to create a
bullish divergence
, a chart signal pointing to easing selling momentum.
More recently, Wednesday’s close above the 50-day MA on the highest
trading volume
since early July increases the chances of a potential upside trend reversal.
The stock was up slightly at $89.40 in the opening minutes of trading Thursday.
Monitor These Levels Amid Follow-Through Buying
Amid follow-through buying in Albemarle shares, investors should eye four key chart levels likely to gain attention.
The first level to watch sits around $91, an area currently just 2% above Wednesday’s close where the shares may run into
resistance
near a trendline joining several lows throughout June and July with the August retracement
swing high
.
Further buying could instigate a rally up to the key $112 area, where sellers may look to
lock in profits
near a
confluence
of resistance from multiple lows on the chart from November to April, the descending channel’s upper trendline, and the downward sloping 200-day MA.
A
breakout
above this level could see the stock climb to $131. This location may attract selling interest near peaks that formed on the chart between November and May during a period of
sideways drift
within the stock’s longer-term
downtrend
.
Finally, a more
bullish
move higher may lead to a retest of the $153 region, where investors may place sell orders near the early October low, which closely aligns with the December swing high.
The comments, opinions, and analyses expressed on Investopedia are for informational purposes only. Read our
warranty and liability disclaimer
for more info.
As of the date this article was written, the author does not own any of the above securities.
Read the original article on
Investopedia
.
