
Watch These Atlassian Price Levels as Stock Regains Momentum
Shares Gained 9% Last Week

Key Takeaways
Shares in collaboration software maker Atlassian (
TEAM
) will remain in focus on Monday following last week’s gain of 9%.
Still, the company’s shares trade down more than 35% on the year, with the price plumbing a
52-week low
earlier this month after the company issued a
soft revenue outlook
below Wall Street estimates and announced the departure of Chief Sales Officer Kevin Egan. However, the stock’s recent momentum shift suggests concerns over sales growth and executive changes may be mostly
baked in the cake
.
Below, we analyze Atlassian’s chart and turn to
technical analysis
to identify key price levels that investors will likely be watching.
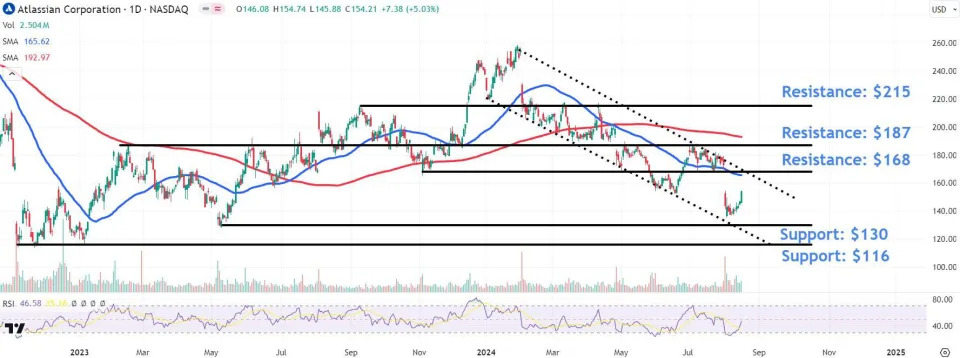
Shares Trade Within Descending Channel
Since recording its 2024 high in January, Atlassian shares have traded within an orderly
descending channel
, a chart pattern that indicates a downward trend, but can also signal a trend reversal upon a
breakout
.
More recently, the stock has climbed around 14% from its recent post-earnings 52-week low, registering four consecutive days in the green between Tuesday and Friday last week.
The stock gained 5% on Friday to finish at $154.21.
Higher Price Levels to Watch
Looking ahead, investors should monitor three key higher price levels that Atlassian stock could test amid strengthening price momentum.
The first sits around $168, an area on the chart that finds a
confluence
of resistance from the prominent November 2023 swing low, the channel’s upper trendline, and the downward sloping
50-day moving average
.
A move above this level could see the shares test $187, where they may encounter selling pressure near a trendline joining multiple
peaks and troughs
from February last year to July this year.
Ongoing buying could fuel a move up to $215, a location where sellers may be happy to take profits near a
horizontal line
linking three peaks that formed on the chart between September 2023 and April.
Support Areas Worth Monitoring
Despite the recent bullish
price action
in the stock, it’s also worth monitoring several important
support
areas.
An initial retracement from current levels could see the shares revisit the $130 area, a region where they may attract buyers seeking
entry points
situated around the May 2023
swing low
.
A failure to hold this level raises the possibility for a retest of $116 near the channel’s lower trendline, where the price would likely find major support from three key troughs that formed on the chart between November 2022 and January 2023.
The comments, opinions, and analyses expressed on Investopedia are for informational purposes only. Read our
warranty and liability disclaimer
for more info.
As of the date this article was written, the author does not own any of the above securities.
Read the original article on
Investopedia
.
