
Watch These Walmart Price Levels After Stock Surges to Record High

Key Takeaways
Walmart (
WMT
) shares surged Thursday after the company reported
second-quarter earnings that topped estimates
and lifted its full-year outlook, as cost-conscious consumers turned to the discounter retailer for purchasing essential items. The stock gained 6.6% to $73.18, a new record closing high.
Below, we take a closer look at the
technicals
on Walmart’s chart and point out important price levels to watch out for following the stock’s earnings-driven jump.
Stock Gap to New All-Time High
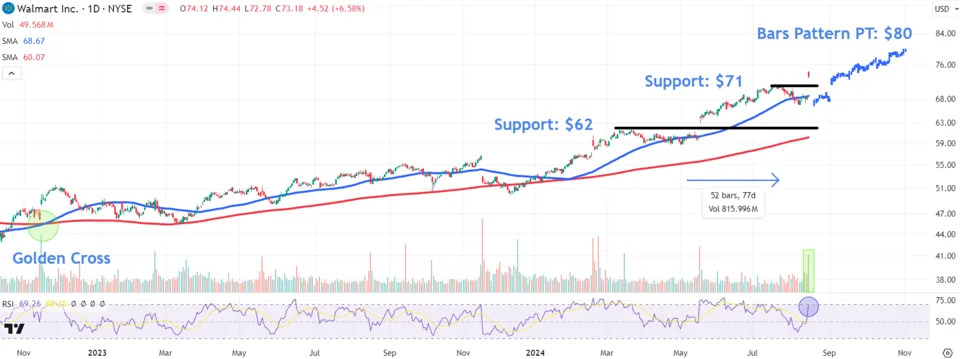
Walmart shares have remained in a long-term uptrend since the 50-day
moving average (MA)
crossed above the 200-day MA to generate a
golden cross
buy signal in November 2022.
More recently, the big box retailer’s stock has undergone a pullback of around 6%, but promptly found buying interest near the 50-day MA prior to Thursday’s earnings-driven gap to a new
all-time high (ATH)
.
Importantly, Thursday’s move occurred on the highest
volume
since mid May, suggesting active participation by
institutional investors
.
Watch This Key Upside Price Level
Given Walmart shares now trade in blue sky territory with no higher price action on the chart to analyze, we can use a bars pattern to project a potential
price target
. We do this by taking the stock’s trending move from early May to mid-July and positioning it from this month’s low. Doing so forecasts an upside target of around $80.
This technique also provides a timeframe of when Walmart shares may reach the target outlined above if price history rhymes. The prior trending move took place over 52 trading days, meaning that if a similar trend plays out, the shares could reach this target by around late October.
Retracement Areas to Monitor
Although the stock registered a record close on Thursday, there’s always the possibility for profit taking after a strong move, especially with the
relative strength index (RSI)
indicator nearing overbought territory. Investors, therefore, should monitor these two key
support
levels that may come into play during retracements.
The first sits around $71, an area near the stock’s prior
record high
that may need to be tested before a sustained move higher.
A more significant pullback could see the shares revisit the $62 area, a location on the chart just above the rising 200-day MA likely to encounter support from a two-month period of price
consolidation
between March and May.
The comments, opinions, and analyses expressed on Investopedia are for informational purposes only. Read our
warranty and liability disclaimer
for more info.
As of the date this article was written, the author does not own any of the above securities.
Read the original article on
Investopedia
.
