
Higher Probability Entries
Student’s Question:
Can you give an example of some of things (signals) you look for in what you refer to as a higher probability entry? Thanks.
Instructor’s Response:
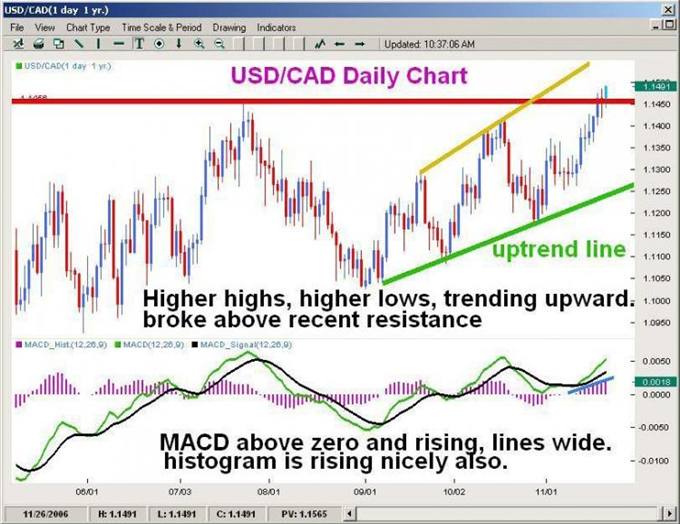
Sure…Take a look at the historical chart of the
USDCAD
below…

First off, at the time of this chart, the Daily trend on this pair was to the upside.Our first “filter” in determining a higher probability entry is one that is in the direction of the Daily trend.Next, we see that price action has broken above resistance…the red line on the chart. When a candle closes above a resistance level, that in an indication that a continued bullish move may ensue.We could then check other indicators…the MACD in this instance. When the MACD line is above the zero line (the mid point of the histogram bars) bullish positions are favored. Also, we see that the MACD line (green) has crossed over the Signal line (black) to the upside. Moreover, the angle and the separation between the two lines is increasing…another bullish signal. Lastly, in this instance, we see the histogram bars building in the direction of the overall move…to the upside.In this trading scenario we have several signals that are confirming the uptrend that we have noted on the chart.The reverse of all of the above would be signals that we look for if the trend were to the short side…a selling opportunity as opposed to a buying opportunity.
