
AI Optimism Has Lifted This Nuclear Stock 100% This Month. What’s Next?

Key Takeaways
Oklo (
OKLO
) shares surged to another record high Friday as investors continue to bid up nuclear energy companies on expectations of growing energy demand to support
artificial intelligence
infrastructure.
The latest round of investor enthusiasm came after the announcement this week of a
$500 billion AI infrastructure development project
. The initiative, a joint venture between Oracle (
ORCL
), OpenAI, and Japan’s SoftBank, bodes well in particular for Oklo. The nuclear company is backed by
OpenAI
CEO Sam Altman and could win energy agreements to power data centers built under the project.
Oklo shares were up 10% at $42.50 in afternoon trading Friday. The stock has doubled since the start of 2025, leading a
big rally for nuclear energy companies
.
Below, we take a closer look at Oklo’s chart and apply
technical analysis
to point out key price levels worth watching out for.
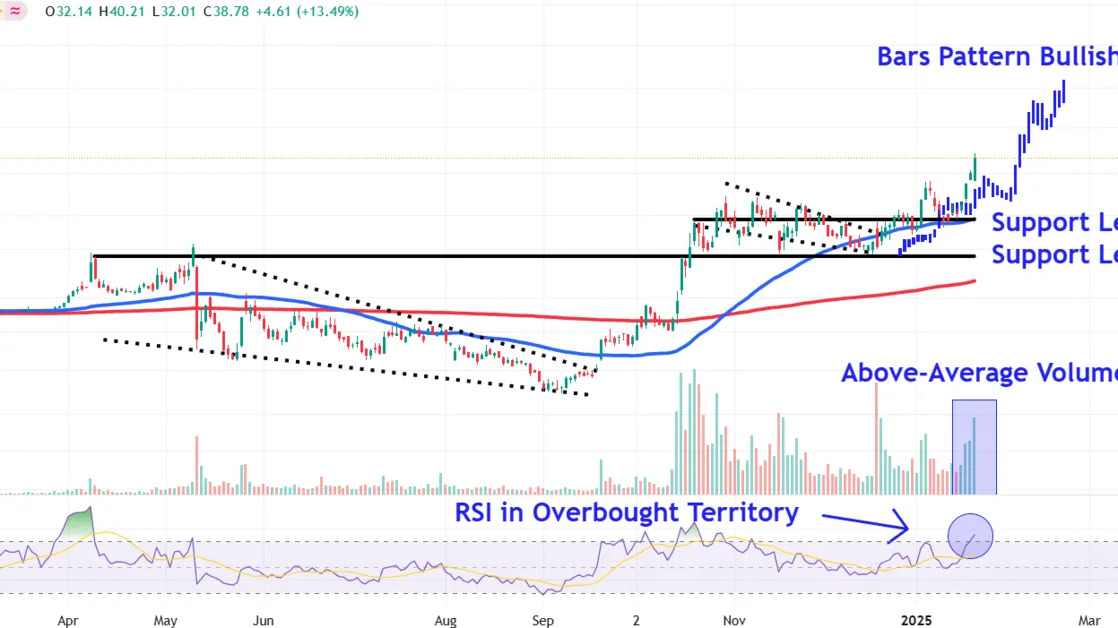
Falling Wedge Breakout
After a
volume
-backed breakout above key
resistance
in mid-October, Oklo shares consolidated within a
falling wedge
for several months before breaking out above the pattern in late December.
Since that time, the stock has continued to trend sharply higher, with gains accelerating on increasing share turnover in recent trading sessions, suggesting
institutional
buying participation.
While the
relative strength index (RSI)
confirms the stock’s strong price momentum, the indicator has moved into
overbought
territory, raising the prospect of short-term profit taking.
Let’s turn to Oklo’s chart to forecast a bullish
price target
and identify major
support levels
that could come into focus during
pullbacks
.
Bullish Price Target Forecast
Investors can forecast a bullish target by using bars pattern analysis, a technique that studies prior trends to anticipate future price movements, based on the assumption that
price history
often rhymes.
When applying the tool to Oklo’s chart, we take the price bars comprising the stock’s trend from early September to late October and reposition them from last month’s low. This projects a bullish target of around $75, a location where investors may decide to
lock in profits
.
We selected this prior move because it also commenced from the lower trendline of an earlier falling wedge pattern on the chart and closely mimics the current uptrend.
Major Support Levels to Monitor
During profit-taking, investors should initially keep track of the $23 level. This area on the chart encounters a
confluence
of support from the recent retest of the
50-day moving average
and a series of comparable price points stretching back to late October.
Finally, selling below this level could see Oklo shares decline to around $17. Investors may seek
entry points
in this region near a
horizontal line
than links the prominent April and May peaks with last month’s trough.
The comments, opinions, and analyses expressed on Investopedia are for informational purposes only. Read our
warranty and liability disclaimer
for more info.
As of the date this article was written, the author does not own any of the above securities.
Read the original article on
Investopedia
