
Apple Stock Avoided the DeepSeek Selloff—Watch These Key Price Levels

Key Takeaways
Apple (
AAPL
) shares posted solid gains again Tuesday after avoiding the big tech selloff to start the week.
As AI-linked stocks
tumbled Monday
on news that a sophisticated AI model developed by Chinese startup
DeepSeek
can compete with leading American models at a fraction of the cost, Apple shares climbed as investors concluded it wasn’t all bad news for the iPhone maker.
Apple’s success
hinges on developing devices powerful enough to run complex AI models, meaning that more cost-effective and efficient AI could directly benefit the company’s
bottom line
. What’s more, Apple, which only announced its AI-powered phone in June last year, has invested modestly on AI compared to its
mega cap
tech rivals.
Apple shares rose 3.7% to Tuesday to close at $238.26, as the
broader market recovered
from Monday’s selloff. The company is due to
report quarterly earnings
after the closing bell on Thursday.
Below, we break down the
technicals
on Apple’s chart and identify key price levels worth watching out for.
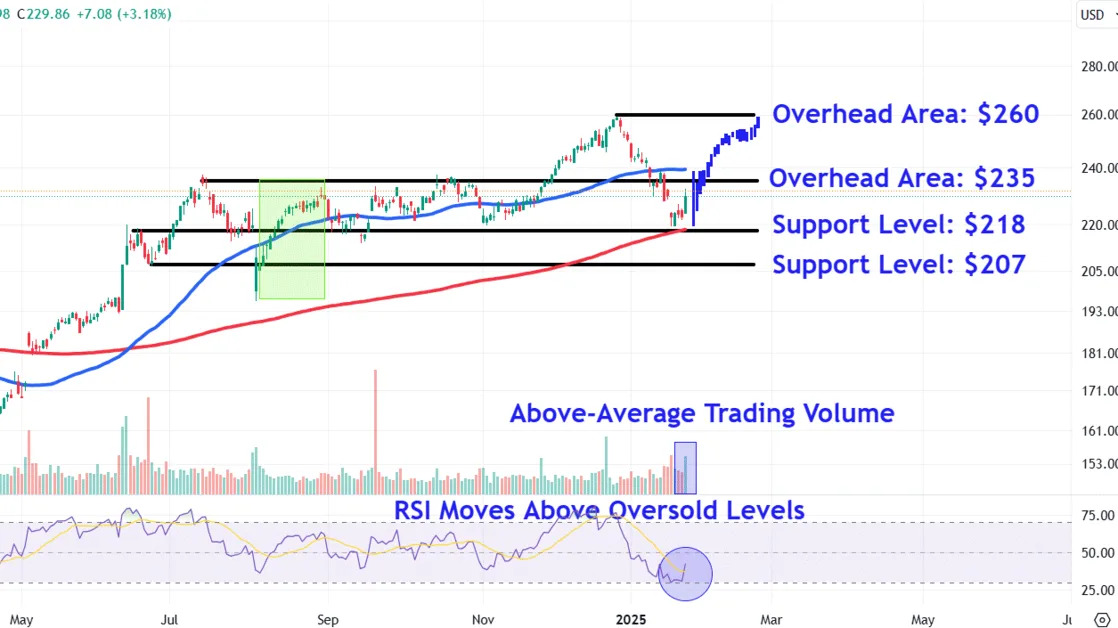
200-Day Moving Average Provides Support
After hitting a record high in late December, Apple shares retraced as much as 16% before finding support early last week around the
200-day moving average
.
Moreover, the stock’s recent turnaround corresponds with the
relative strength index (RSI)
climbing out of
oversold
territory, confirming improving price momentum. It’s also worth noting that Monday’s against-the-market move occurred on above-average
trading volume
, signaling
institutional
buying activity.
Key Overhead Area to Watch
Apple shares closed above a key area of
resistance
on Tuesday. Heading into the session $235 was seen as a level that could run into selling pressure, as it was near a trendline that joins multiple
peaks
on the chart between July and October. This location also closely corresponded with the
38.2% Fibonacci retracement level
when applying the tool from the last month’s high to this month’s low.
Now that the stock has closed just above that level, the price could climb to around $260, a region on the chart likely to gain significant attention near the stock’s
all-time high
. Interestingly, this location also roughly aligns with a bars pattern projected price target that takes last August’s
trending
move higher and overlays it from this month’s low.
Important Support Levels to Monitor
Upon a retracement, investors should monitor how the price responds to a retest of this month’s low around $218. The area finds a
confluence
of
support
from the rising 200-day MA and a trendline that links several peaks and troughs on the chart extending back to mid-June last year.
Finally, a more significant decline could see Apple shares fall to the $207 level. Investors seeking to optimize
entry points
may look for buying opportunities near the June
pullback
low, an area which also closely aligns with several price points situated just above the early August trough.
The comments, opinions, and analyses expressed on Investopedia are for informational purposes only. Read our
warranty and liability disclaimer
for more info.
As of the date this article was written, the author does not own any of the above securities.
Read the original article on
Investopedia
