
Dow Jones Industrial Average Levels to Watch as Index Rides 9-Day Losing Streak

Key Takeaways
The Dow Jones Industrial Average (
DJI
) enters trading Wednesday on a nine-day losing streak, the longest stretch of consecutive daily declines for the blue chip index since 1978.
The slump, which equates to nearly 1,600
points
, comes after the index closed above the closely watched 45,000 level for the first time on Dec. 4 following an extended post-election rally fueled by expectations of a market-friendly White House and Congress.
Despite the recent losing streak, the index is still up 15% in 2024. However, that return significantly underperforms the
S&P 500’s
27% gain and the
Nasdaq Composite’s
34% jump over the same period due to the Dow’s smaller exposure to
mega cap
tech companies.
Below, let’s break down the
technicals
on the Dow’s chart and point out important chart levels that investors may be watching out for.
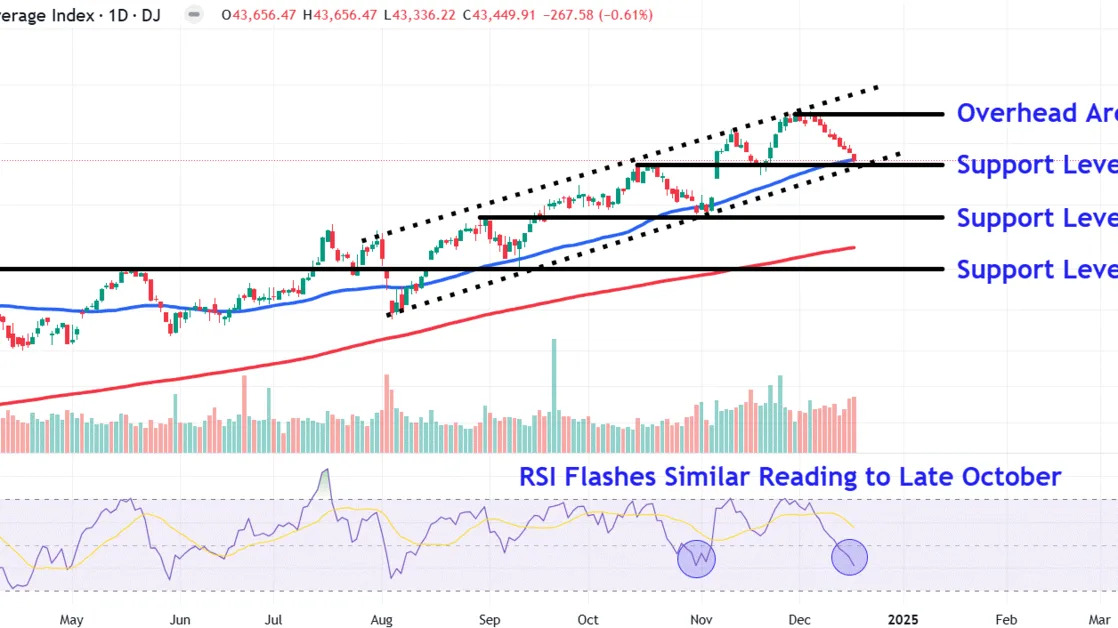
Ascending Channel in Focus
The Dow has tracked higher within an orderly
ascending channel
since late July, with the index tagging the pattern’s upper and lower trendlines several times to establish easily identifiable
support and resistance
areas.
More recently, the index has trended lower after running into resistance near the channel’s top trendline earlier this month, raising the possibility of a potential
breakdown
.
While the
relative strength index (RSI)
confirms weakening momentum, it’s worth noting that the last time the indicator flashed a similar reading in late October, the Dow went on to rally 6% over the next seven trading sessions.
Let’s look at three major levels on the chart where the index could encounter support and also point out a key overhead area to watch during upswings.
Major Support Levels to Watch
The most immediate level to watch sits around 43,300. This area, just below the index’s latest close of 43,450, finds a
confluence
of support from the ascending channel’s lower trendline, the upward sloping
50-day moving average
, the October
swing high
and the November
swing low
.
A decisive breakdown below the ascending channel could see the index fall to the 41,600 level. Investors who trade the index could look for buying opportunities near the prominent late August
peak
and early November trough.
An extended
downside
move could see the index revisit the
psychological
40,000 level, a region where it would likely encounter support near a long-term trendline that links various swing highs and swing lows on the chart between March and September.
Key Overhead Area to Monitor During Upswings
During upswings, investors should closely monitor the key 45,000 level. The index could run into overhead resistance in this area near the upper range of a series of
candlesticks
positioned around the Dow’s
all-time high (ATH)
.
The comments, opinions, and analyses expressed on Investopedia are for informational purposes only. Read our
warranty and liability disclaimer
for more info.
As of the date this article was written, the author does not own any of the above securities.
Read the original article on
Investopedia
