
Intel Stock Price Levels to Watch After CEO Shakeup

Key Takeaways
Intel (
INTC
) shares will likely remain on watchlists Tuesday, a day after the embattled chipmaker said
CEO Pat Gelsinger had stepped down
and will be replaced by a pair of interim co-CEO’s as it searches for a permanent replacement.
Gelsinger, who joined the chip giant in February 2021, had come under increasing pressure this year as the company implemented a
turnaround plan
that spurred significant job losses and the
divestiture
of some assets. Intel has been struggling to reclaim lost
market share
from its chipmaking rivals and restore investor confidence.
Since the company reported a wider-than-expected
net loss
for the second quarter in August, weeks of speculation about strategic changes and reports of
deal activity
have continued to swirl, but failed to boost investor confidence. Although Intel shares have recovered slightly over the past month, they have still lost
more than half of their value
since the start of the year.
The stock rose as much as 6% on Monday following news of Gelsinger’s departure, but finished the session down 0.5%. The stock was little changed in premarket trading Tuesday at around $24.
Below, we take a closer look at Intel’s chart and turn to
technical analysis
to point out several key price levels worth watching out for.
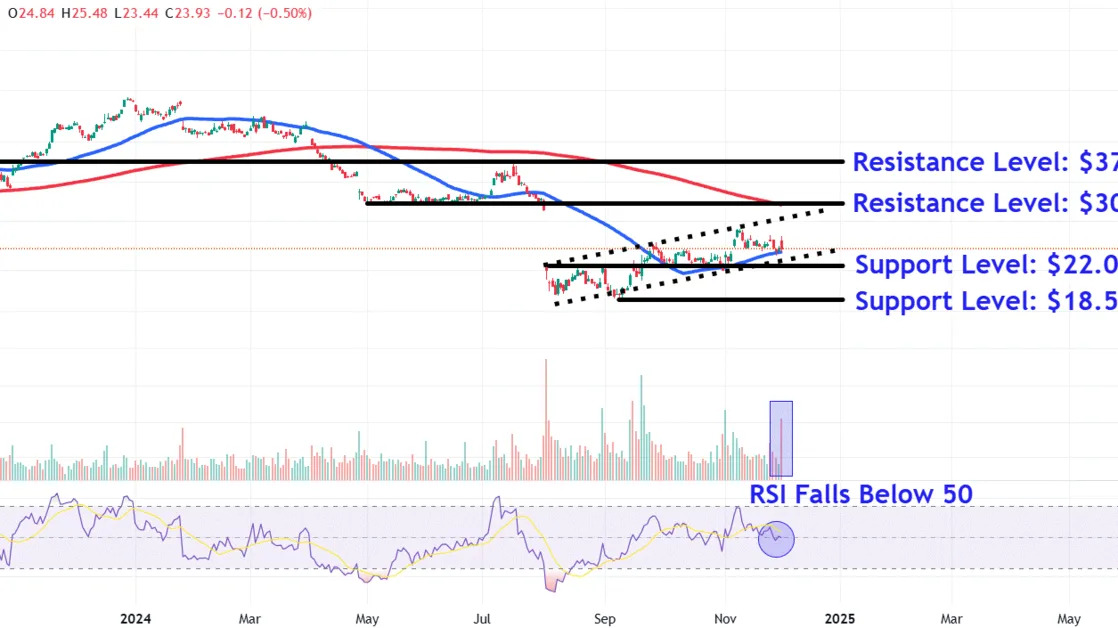
Selling Volume Increases
After
gapping
more than 25% lower in early August, Intel shares have traded within an orderly
ascending channel
, with the price tagging both sides of the pattern on several occasions since that time.
More recently, the stock dropped towards the
50-day moving average (MA)
on the highest
volume
in more than a month Monday, indicating selling conviction behind the move.
Meanwhile, the
relative strength index (RSI)
continues to retreat from
overbought
levels, falling below 50 yesterday to signal weakening price momentum.
Let’s look at key
support and resistance
levels on Intel’s chart that investors are likely monitoring.
Key Support Levels to Watch
A decisive
breakdown
below the 50-day MA could see shares decline to around $22. Investors may look for buying opportunities in this area near the
opening price
of the early-August gap, which also aligns with a range of similar trading levels on the chart between late August and early November.
Selling below this level opens the door for retest of lower support at the $18.50 level, a location around 23% below Monday’s closing price where bargain hunters could look for
entry points
near the September low.
Important Resistance Levels to Monitor
The first overhead level to monitor sits around $30. This area on the chart finds a
confluence
of resistance from the
200-day MA
and lower range of a narrow
consolidation
period that formed on the chart between May and June.
Finally, a more bullish move could propel a rally up to the $37 level. Investors who have purchased Intel shares at lower prices could look to
lock in profits
near a multi-month trendline that connects a series of
peaks
on the chart from June 2023 to July this year.
The comments, opinions, and analyses expressed on Investopedia are for informational purposes only. Read our
warranty and liability disclaimer
for more info.
As of the date this article was written, the author does not own any of the above securities.
Read the original article on
Investopedia
