
Meta Is The Only Magnificent 7 Stock In The Green In 2025—Watch These Key Levels

Key Takeaways
Meta Platforms (
META
) shares jumped on Friday amid a broader market rally, after logging their biggest one-day drop since July the previous session.
The social media giant’s stock has come under pressure over the past month as the broader market has tumbled, with Big Tech stocks suffering outsize losses amid concerns about lofty valuations and slowing growth. Meta shares are down 18% from their record high set in mid-February.
However, Meta is the only member of the
Magnificent Seven
group of mega-cap technology stocks that remains in positive territory for 2025. The stock is up nearly 4% since the start of the year, while each of the other Mag 7 stocks is down at least 8%.
Below, we break down the
technicals
on Meta’s chart and identify major price levels worth watching out for amid the possibility for further price swings.
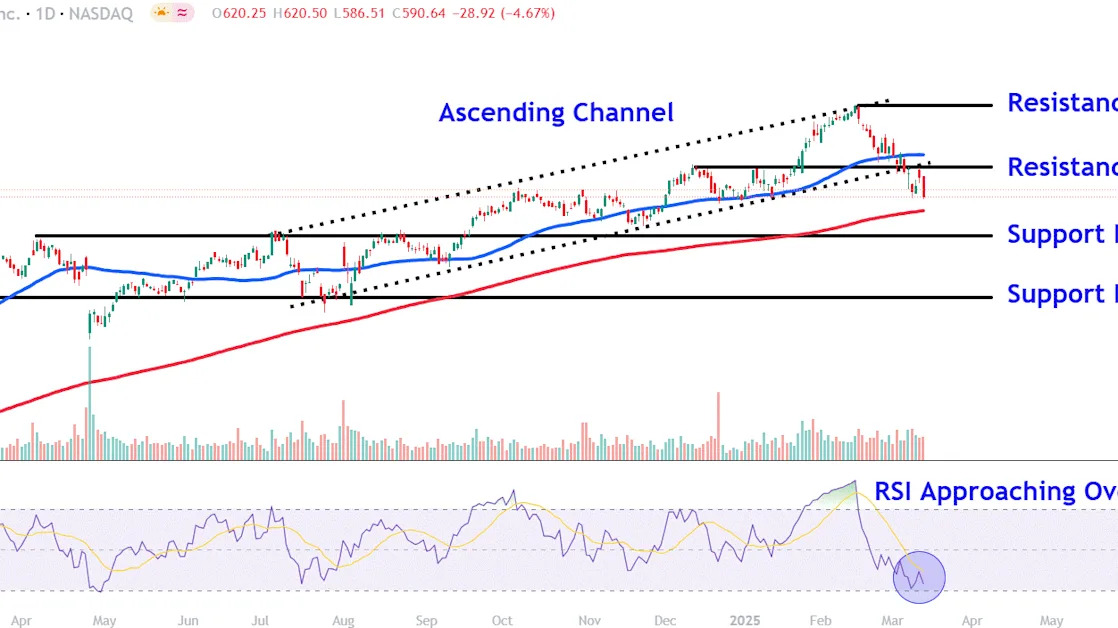
Ascending Channel Breakdown
Meta shares staged a decisive
breakdown
below an
ascending channel
on Monday before the price retested the pattern’s lower trendline in Wednesday’s trading session. Bears used the bounce as an opportunity to accelerate selling yesterday, before today’s recovery.
Meanwhile, the
relative strength index (RSI)
confirms weak price momentum with a reading near its August lows, though looming
oversold
conditions may trigger short-term recovery rallies in the stock.
Let’s use
technical analysis
to locate major
support and resistance
levels that investors may be monitoring.
Crucial Resistance Levels to Track
Meta shares rose 3% on Friday to close at $607.60, after falling nearly 5% yesterday.
The first overhead level to monitor is $635, an area that provides a
confluence
of resistance from the ascending channel’s lower trendline that sits alongside peaks which formed on the chart in December and January.
A convincing close above this level may see
bulls
make another run at the $740 level, a location on the chart where Meta shares would likely attract significant attention near their
all-time high (ATH)
.
Major Support Levels to Watch
The first support level to watch sits around $535. The shares could find buying interest in this area near a multi-month trendline that connects three prominent
peaks
on the chart between April and August last year.
Selling below this important technical level could see the stock revisit lower support at the $460 level. Investors who favor
buy-and-hold
strategies may look for
entry points
in this region near the low of a consolidation period that followed last year’s February
breakaway gap
, a location that also roughly aligns with the July and August troughs.
The comments, opinions, and analyses expressed on Investopedia are for informational purposes only. Read our
warranty and liability disclaimer
for more info.
As of the date this article was written, the author does not own any of the above securities.
Read the original article on
Investopedia
