
Meta’s Stock Is On A Record Winning Streak—Watch These Price Levels

Key Takeaways
Meta (
META
) shares extended their
record winning streak
Monday to 16 consecutive trading sessions, the longest run of wire-to-wire green days of any
Magnificent Seven
stock.
The social media giant’s stock has been unstoppable since Jan. 17, gaining momentum late last month after the company
reported better-than-expected earnings
.
Even as news of advanced
artificial intelligence (AI)
technology from Chinese startup
DeepSeek
recently rattled many mega cap tech stocks, Meta shares continued their move higher, in part, because investors see the company as more of a consumer of AI rather than a provider. They also favor that the company’s AI model
Llama remains open source
like DeepSeek’s.
More recently, the stock received a further boost after the company said it plans to commence a previously announced round of performance-based layoffs of about 5% of its staff.
Meta shares have gained 23% since the start of the year as of Monday’s close and trade more than 50% higher over the past 12 months, comfortably surpassing the
S&P 500
’s returns over the same periods of 3% and 21%, respectively.
Below, we take a closer look at Meta’s chart and use
technical analysis
to point out key price levels that investors may be watching.
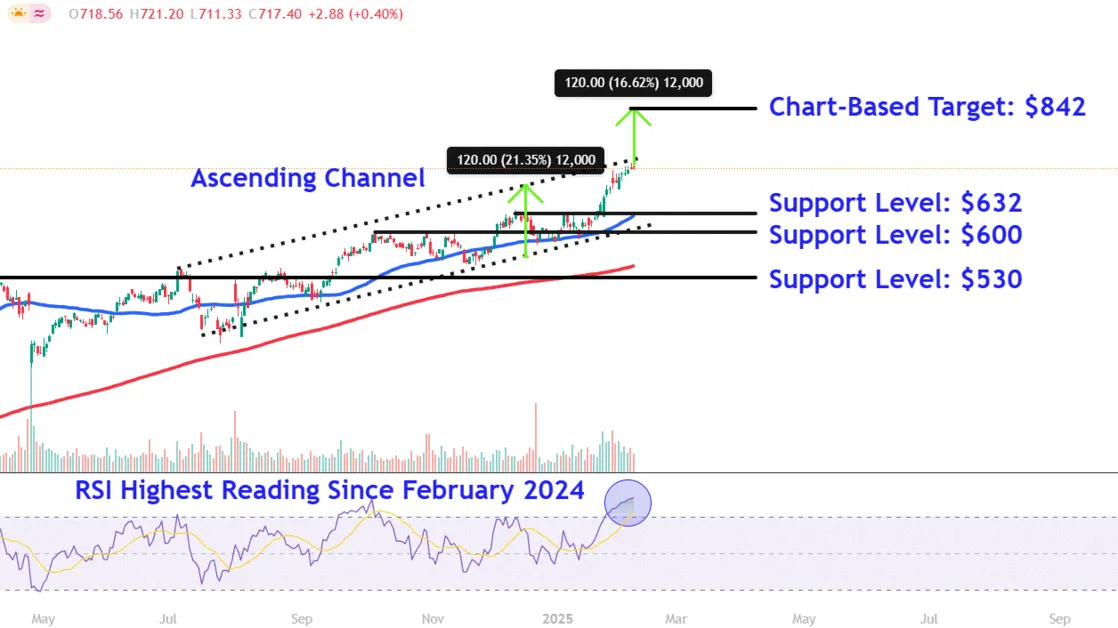
Ascending Channel Breakout Watch
Meta shares have trended higher within an
ascending channel
sine July last year. More recently, the stock’s string of consecutive gains sees the price testing the pattern’s upper
trendline
, potentially setting the stage for a
breakout
attempt.
Meanwhile, the
relative strength index (RSI)
has crossed above the 80 threshold for the first time since February last year to confirm strong price momentum but also caution investors of
overbought
conditions in the stock.
Let’s identify a chart-based target to monitor if the stock moves into
price discovery
mode and also locate three key
support levels
worth watching during possible retracements.
Chart-Based Target
If Meta shares continue their move significantly higher, investors can forecast a target by applying the
measuring principle
, a technique to analyzes
chart patterns
to projects future price movements.
When applied to Meta’s chart, we calculate the distance from the ascending channel’s lower to upper trendline and add that amount to the top of the pattern. In this case, we add $120 to $722, which forecasts a target of $842, a level 17% above Monday’s closing price where investors may look to
lock in profits
.
Key Support Levels Worth Watching
Upon an initial dip, investors should watch the $632 level. The shares could find support in this area near the December and January
peaks
, which currently closely align with the upward sloping
50-day moving average
.
A close below this level could see the shares retrace to around $600, a level where they may attract buying interest near the
psychological round number
and a range of peaks and troughs stretching back to the October
swing high
.
Finally, a decisive
breakdown
below the ascending channel’s lower trendline could bring the $530 level into play. Investors may look for
entry points
in this region near a
horizontal line
that links a series of comparable
price action
on the chart from April to September last year.
The comments, opinions, and analyses expressed on Investopedia are for informational purposes only. Read our
warranty and liability disclaimer
for more info.
As of the date this article was written, the author does not own any of the above securities.
Read the original article on
Investopedia
