
Mobileye Stock Price Levels to Watch After This Week’s 28% Drop

Key Takeaways
Mobileye Global (
MBLY
) shares lost more than a quarter of their value this week as investors were left unimpressed by the autonomous driving company’s presentation at the CES consumer electronics trade show.
Bloomberg Intelligence
analyst Jake Silverman pointed out that CEO Amnon Shashua’s address at the highly anticipated event in Las Vegas didn’t provide any updates on commercial wins, likely disappointing investors after the company unveiled promising driving assistance technology at its capital markets day in December.
The Israeli-based company’s stock lost more than half its value last year as its sales came under pressure from customers carrying too much inventory and a broader industry slowdown in China and Europe amid uncertainty surrounding global
self-driving
regulations.
Mobileye shares fell 7.7% to $15.65 on Friday, amid a broader
downturn for U.S. stocks
. The stock declined 28% over the week.
Below, we take a closer look at Mobileye’s chart and use
technical analysis
to identify important price levels worth watching out for.
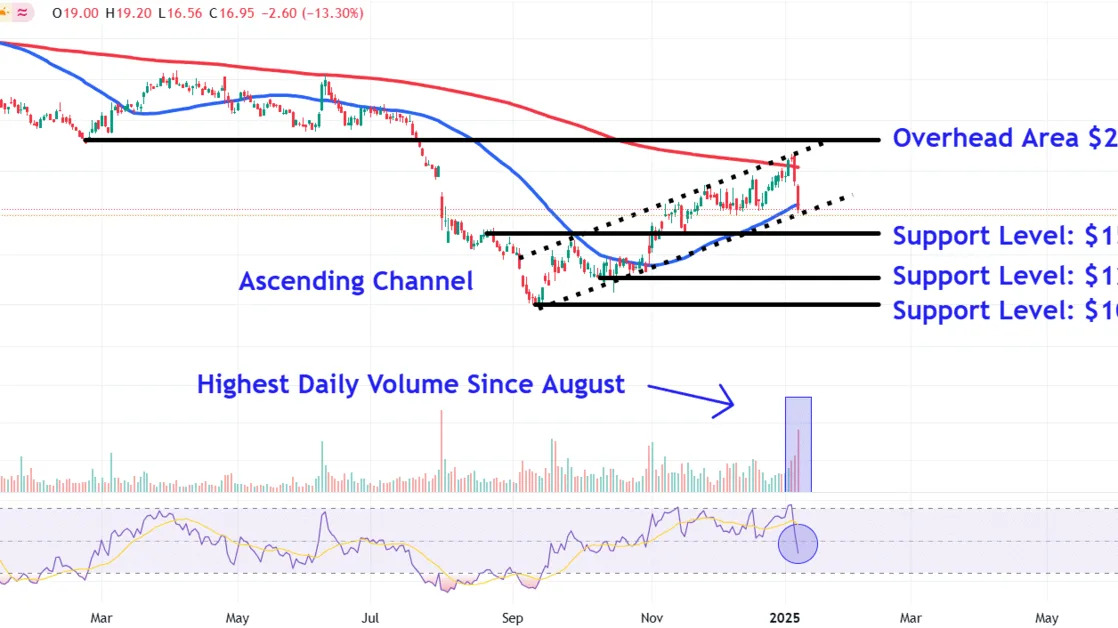
Ascending Channel in Play
After bottoming out in mid-September, Mobileye shares have trended higher within an orderly
ascending channel
, a chart pattern comprising two parallel upward sloping trendlines.
However, more recently, the price ran into overhead resistance near the pattern’s upper trendline and the nearby
200-day moving average (MA)
. Moreover, Wednesday’s 13%
sell-off
occurred on the highest
volume
since early August last year.
It’s also worth noting the speed of the drop, with the
relative strength index (RSI)
falling from
overbought conditions
to below the 50 threshold in less than a week.
Let’s identify crucial
support levels
to watch if the stock remains in its longer-term downtrend and also point out a major overhead area worth monitoring upon a bullish reversal.
Crucial Support Levels to Watch
A convincing
breakdown
below the ascending channel’s lower trendline and 50-day MA could see the shares initially decline to around $15. This level on the chart may provide support near a
horizontal line
that connects the late August
countertrend
peak, the September peak and mid-November pullback low.
Selling below this level brings the $12 level into play, a location on the chart where the shares may encounter buying interest near a series of prices situated in close proximity to the mid-October
trough
.
Further
downside
could trigger a fall to the $10.50 level. Investors may look to scoop up shares in this area on the chart near the stock’s pronounced September
swing low
.
Major Overhead Area to Monitor
During a recovery in the stock’s price, investors should set an alert at the $24 level. Traders who have attempted to capitalize on the stock’s recent
volatility
may look for exit points near a
confluence
of resistance from the prominent February trough and the ascending channel’s upper trendline.
The comments, opinions, and analyses expressed on Investopedia are for informational purposes only. Read our
warranty and liability disclaimer
for more info.
As of the date this article was written, the author does not own any of the above securities.
Read the original article on
Investopedia
