
Palantir Stock Snapped a Three-Week Losing Streak Last Week—Watch These Key Price Levels

Key Takeaways
Palantir Technologies (
PLTR
) shares were down slightly on Monday after gaining ground last week for the first time in four weeks.
Shares in the data analytics software company had come under pressure amid the political and economic uncertainty that has roiled financial markets, as well as specific concerns that reduced spending by the Department of Defense could cut into Palantir’s business. The stock fell nearly 40% from its record high, set in mid-February, in less than three weeks.
The
stock bounced back
last week after the AI investor favorite announced six
new large clients
and inked a strategic product
partnership
with Nvidia (
NVDA
)-backed startup, Databricks.
Despite the stock’s recent
retracement
, Palantir shares have gained about 14% since the start of the year and more than quadrupled in 2024 as commercial and
public sector
customers embrace the company’s AI-powered software to customize data aimed at improving efficiency. The stock was down 0.7% at $85.60 in recent trading.
Below, we take a closer look at Palantir’s chart and use
technical analysis
to identify key price levels worth watching out for.
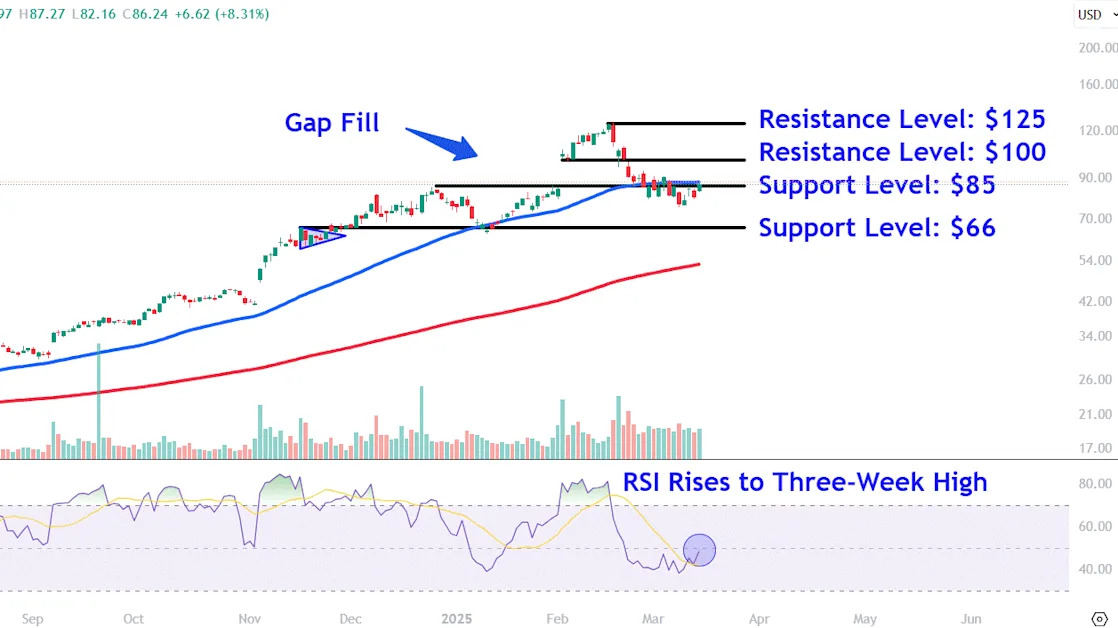
Gap Fill
After the stock’s large drop, the shares found buying interest after the price filled an early-February
breakaway gap
. However, more recently, the price has traded mostly
sideways
, indicating indecision among market participants.
While the
relative strength index (RSI)
sits below the 50 threshold, the indicator climbed to its highest level in three weeks on Friday, signaling improving momentum.
Looking ahead, let’s point out key
support and resistance
levels on Palantir’s chart that investors may be eyeing.
Key Support Levels to Watch
Investors should initially keep a close eye on the $85 level. While the stock traded below this price for most of last week, it managed to close above it on Friday. The location will likely continue to attract attention, given its proximity to the nearby
50-day moving average
and an area of prior resistance that preceded last month’s breakaway gap.
The bulls’ failure to defend this level could see a retreat to around $66. Buyers may look for
entry points
in this region near the top of a prior
pennant pattern
, which roughly aligns with the mid-January
swing low
.
Important Resistance Levels to Monitor
A continuation of Friday’s buying momentum could see the shares make a move towards the
psychological
$100 level. Investors who have bought the stock’s recent
pullback
may look to lock in profits in this location near the low of a brief
consolidation
period that followed last month’s gap.
Finally, a more bullish move may lead to a retest of higher levels around $125. A rally up to this area could see Palantir shares run into selling pressure neat the stock’s
all-time high (ATH)
set last month.
The comments, opinions, and analyses expressed on Investopedia are for informational purposes only. Read our
warranty and liability disclaimer
for more info.
As of the date this article was written, the author does not own any of the above securities.
Read the original article on
Investopedia
