
Salesforce Stock Price Levels to Watch Ahead of Earnings Report

Key Takeaways
Salesforce (
CRM
) shares are in the spotlight this week as the cloud software company is scheduled to release its
quarterly earnings report
after the market closes on Tuesday.
Analysts expect the software maker to report a 7% jump in
year-over-year (YOY)
revenue during the quarter, boosted by growing demand for the company’s
generative artificial intelligence (AI)
product offerings.
In particular, investors will likely be seeking updates about demand for the company’s recently launched Agentforce platform, which enables customers to build and deploy
AI agents
that can autonomously make informed decisions and perform various business functions.
Salesforce shares were up slightly at around $332 in midday trading Monday. The stock has gained 26% since the start of the year, in line with the S&P 500’s increase over the period.
Below, we take a closer look at the
technicals
on the Salesforce
weekly chart
ahead of the company’s quarterly report and identify important price levels worth watching out for.
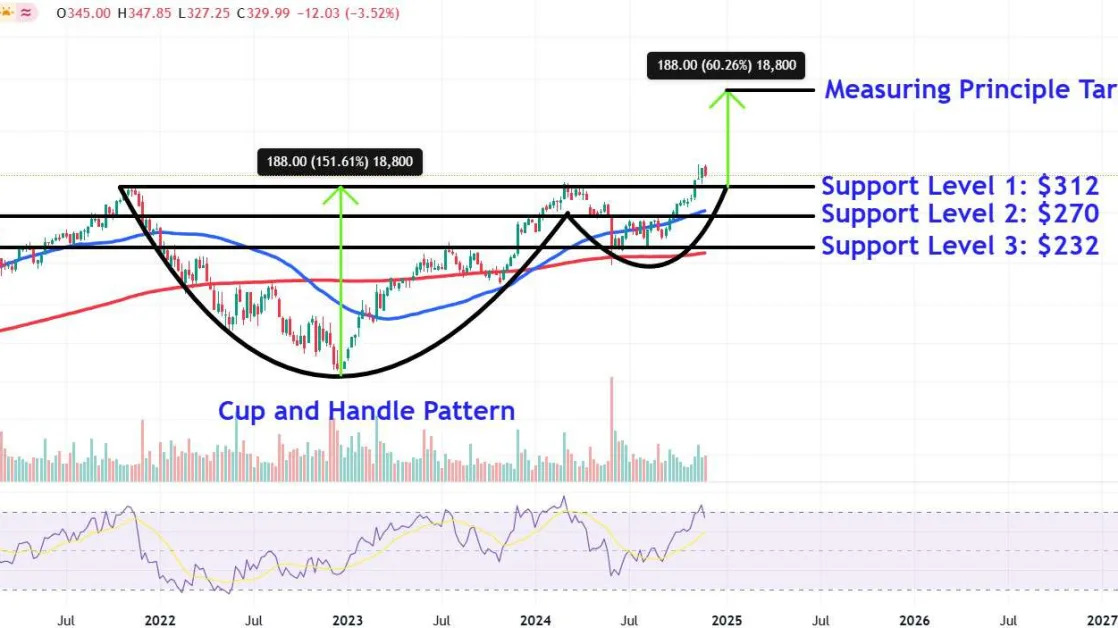
Cup and Handle Pattern
Salesforce shares formed a textbook
cup and handle
between November 2021 and November this year before breaking out above the bullish chart pattern last month.
However, the stock retraced towards the formation’s top
trendline
last week, suggesting caution among investors ahead of the software maker’s quarterly results.
Ahead of the company’s earnings report, let’s point out three important
support levels
to monitor and also use the stock’s chart to projects a potential upside
price target
.
Important Support Levels to Monitor
The first lower support level to watch sits around $312. This area on the chart could find buying interest near the cup and handle pattern’s upper trendline, which may flip from providing prior
resistance
into offering future support.
The
bulls’
failure to defend this level could see the shares fall to the $270 area, a location where the price may encounter support from a trendline that connects a range of similar trading levels on the chart from August 2020 to August this year.
A steeper drop opens the door for a retest of lower support near $232. Investors may look for buy-and-hold
entry points
around this area close to a
horizontal line
that links multiple
peaks and troughs
on the chart extending back to September 2020.
Upside Price Target to Watch
Investors can forecast an upside target using the
measuring principle
, a chart-based technique that analyzes the stock’s prior price
moves
to predict future moves.
To apply the tool to the Salesforce chart, we measure the depth of the cup and handle’s “cup” and add that amount to the pattern’s top trendline. In other words, we add $188 to $312, which projects an upside target of $500, a region where those who have purchased the stock at lower levels may decide to
lock in profits
.
The comments, opinions, and analyses expressed on Investopedia are for informational purposes only. Read our
warranty and liability disclaimer
for more info.
As of the date this article was written, the author does not own any of the above securities.
