
Supermicro Stock Price Levels to Watch After Recent Slump

Key Takeaways
Super Micro Computer (
SMCI
) shares moved higher in premarket trading on Tuesday after tumbling yesterday following news that the stock will be
removed from the Nasdaq 100 Index
and reports that the embattled server maker is exploring ways to
raise capital
.
The stock has had a volatile year, rising to a closing high of $119 in March on the back of
artificial intelligence (AI)
-driven demand before plummeting in mid-November to around $18 following fears of a potential Nasdaq
delisting
after accounting anomalies led to delayed financial reporting.
Over the past month, Supermicro shares have recovered 80% after the company hired a new auditor and secured a
filing extension until Feb. 25
, but have lost nearly a quarter of their value in the last five trading sessions as investors assess the company’s outlook.
The stock was up 2% at around $34 in recent premarket trading.
Below, we take a closer look at Supermicro’s chart and apply
technical analysis
to identify important price level worth watching out for.
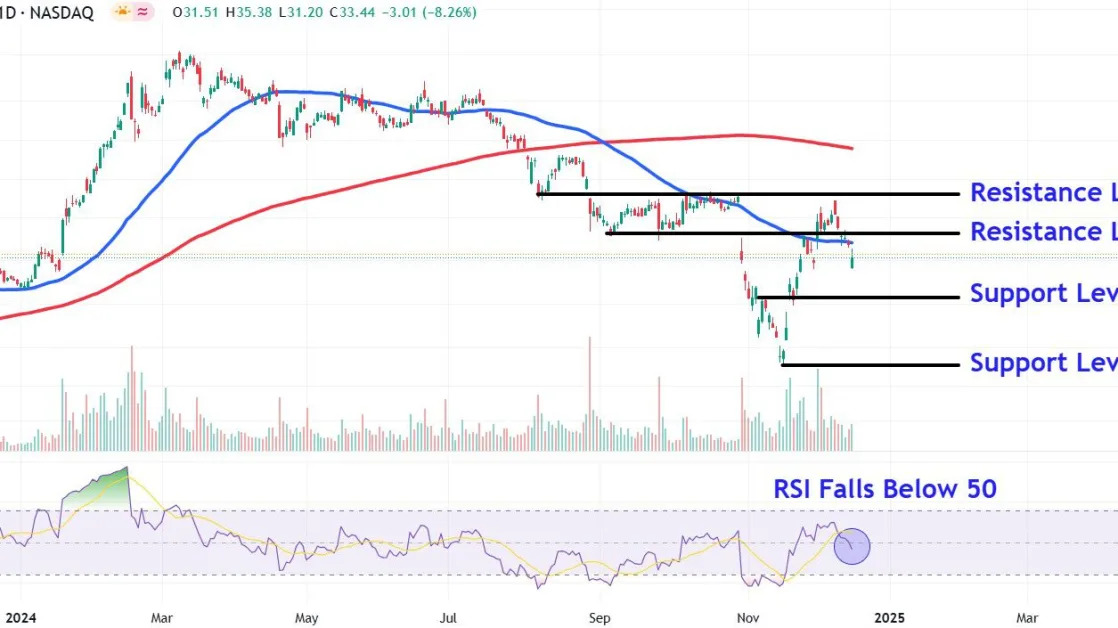
October Gap Fill
Microcomputer shares initially ran into selling pressure last week after rallying nearly two-fold from last month’s low to fill a late October
gap
.
More recently, selling has intensified, with the stock’s price staging a decisive close below the
50-day moving average
on Monday. The
relative strength index (RSI)
confirms weakening price momentum, with the indicator flashing a reading below 50 for the first time since late November.
Let’s point out important
support and resistance
levels that that may attract investors’ interest.
Major Support Levels to Watch
Follow-through selling could see Supermicro shares fall to around $26, a level on the chart where they may encounter support near a
countertrend
peak during the stock’s early-November
sell-off
.
A
breakdown
below this level opens the door for a retest of the $18 level. This location on the chart would likely attract buying interest near last month’s prominent
swing low
, particularly if other
indicators
simultaneously signal
oversold
conditions in the stock.
Crucial Resistance Levels to Monitor
Upon a recovery from current levels, investors should watch how the stock responds to the $39 area, a region where the shares may run into selling pressure near two
troughs
that formed on the chart during September.
Finally, a more bullish move could see the shares climb to around $50. Investors who bought the recent dip may look to offload shares near a
horizontal line
that links the early August trough with the upper level of a
consolidation
period that emerged on the chart throughout most of October within the stock’s broader
downtrend
.
The comments, opinions, and analyses expressed on Investopedia are for informational purposes only. Read our
warranty and liability disclaimer
for more info.
As of the date this article was written, the author does not own any of the above securities.
Read the original article on
Investopedia
