
UnitedHealth Stock Price Levels to Watch After Extended Sell-Off

Key Takeaways
UnitedHealth Group (
UNH
) shares have been on the decline since the CEO of its UnitedHealthcare unit was killed in New York City on Dec. 4.
The stock’s slide, which has significantly contributed to the
Dow Jones index recording its longest losing streak in 50 years
, has also been compounded by recent pressure from Washington targeting
pharmacy benefit managers (PBMs)
, third party administrators that oversee drug programs on behalf of major insurers, such as UnitedHealth.
Earlier this week, lawmakers unveiled a federal spending bill that included a range of PBM proposals focusing on spread pricing, rebates, and reporting transparency. However, analysts say the bill allows PBMs ample time to adjust their business practices, resulting in minimal impact on health insurers’ earnings.
UnitedHealth shares fell 2.1% to $489.25 on Thursday and are down 20% since Dec. 4. The stock has lost 7% since the start of the year.
Below, we take a look at the
technicals
on UnitedHealth’s
weekly chart
to identify key price levels worth watching.
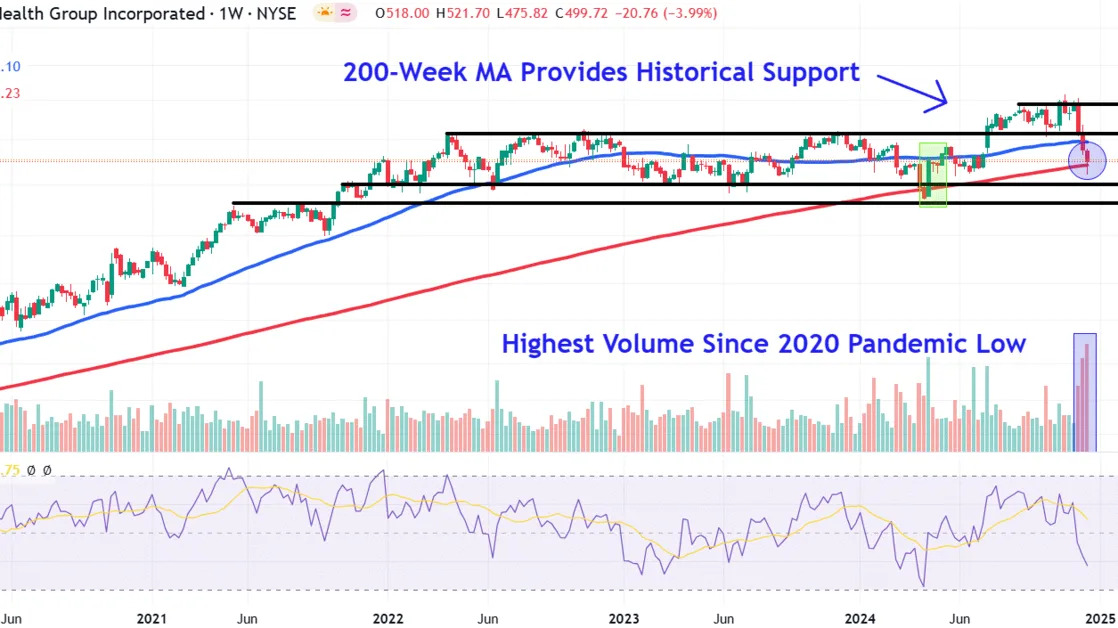
200-Week Moving Average Provides Historical Support
After setting a new
record high
in early November, UnitedHealth shares traded
sideways
for several weeks before commencing their sharp move lower earlier this month on some of the highest
volume
since the 2020 pandemic low.
However, the stock found buying interest around the 200-week moving average (MA) in Wednesday’s trading session. Interestingly, the last two times the price has closed below this closely watched indicator on the weekly
timeframe
—in March 2020 and April this year—the shares rebounded 41% and 19%, respectively, over the next five weeks.
Let’s identify several crucial
support and resistance
levels on UnitedHealth’s chart that investors may be closely monitoring.
Crucial Support Levels to Watch
Selling below the 200-week MA could trigger a fall to around $460. Investors may look for
entry points
at this level near a trendline that connects the November 2021
peak
with multiple troughs on the chart between January 2022 and April this year.
A close below this level could see the price revisit lower support near $430, a location on the chart where buyers may
accumulate
shares around prominent
swing highs
that formed in May and August 2021.
Key Resistance Levels to Monitor
Upon a recovery in the share price, investors should initially monitor how the stock responds to the $550 level. This location, currently just above the 50-week MA, could provide resistance near a
horizontal line
that links an array of comparable price points on the chart from April 2022 all the way to December this year.
Finally, a more bullish reversal could propel a move up to around $610. Investors who have purchased shares at lower levels may look to
lock in profits
near a period on
consolidation
situated just below the stock’s record close.
The comments, opinions, and analyses expressed on Investopedia are for informational purposes only. Read our
warranty and liability disclaimer
for more info.
As of the date this article was written, the author does not own any of the above securities.
Read the original article on
Investopedia
