

USD/JPY Triangle Leads to Continued Trend
The
USD/JPY
has seen a 400 pip price range for the majority of the trading year between 80.00 and 84.00. However, the pair has recently sprung to life looking to continue its four year down
trend
from the May 2007 high at 124.13. Over the last three months, price has steadily created lower highs and lower lows preparing us for a resumption of our larger directional bias.
Fundamentally, the United States continues to be viewed as weak. Holding over 14 trillion plus in public debt, the
US Dollar dilemma
continues making the currency a speculative target. As politicians state side continue to debate and argue over
debt ceilings
and future
quantitative easing
we will look for our trend to continue.

Price Action
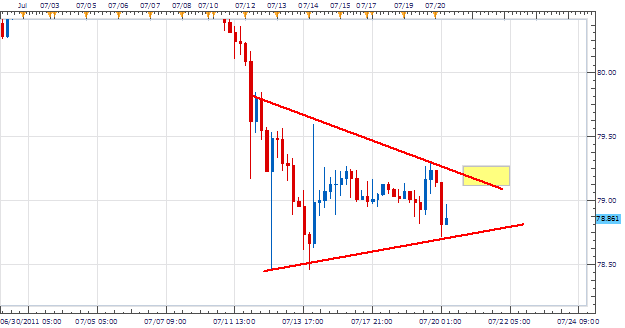
Moving to a 4H chart, we can see price consolidating at the bottom of our previous leg down in a
triangle
formation.
Resistance
is found by connecting the previous highs on July 12th(79.85) and 19th(79.13).
Support
is being held up from the lowest low displayed as
wicks
on the 12th (78.45) and 20th (78.71). Traders have two options, either wait for price to trade up and become
overbought
near resistance to enter with the broader trend or trade a
breakout
of established support.
Trading O
pportunity
My preference is to sell the
USD
/
JPY
against
resistance
at the top of our consolidating triangle near 79.20.
Stops
should be placed over the pattern high over the 79.90 handle.
Limits
should be set at .7780 or better, setting up for a minimum return of 140
pips
for a clear 1:2 Risk/Reward ratios.
Alternative scenarios include price immediately moving below support for a larger breakout below 78.40.
Walker England contributes to the
Instructor Trading Tips
articles.
To receive more timely notifications on his reports, email
to be added to the distribution list.
