
Vistra Stock Plunged Nearly 30% During Monday’s AI Selloff—What Comes Next?

Key Takeaways
Vistra (
VST
) shares fell nearly 30% on Monday as investors questioned whether
artificial intelligence
will
require the huge amounts of computing power
and electricity once expected.
Chinese startup DeepSeek’s
newest open-source AI model
has been found to perform nearly as well as models from American leaders like OpenAI and Google at a fraction of the cost. That has prompted concerns among Vistra investors that the big U.S. tech companies developing cutting-edge AI may not need as much power as previously anticipated.
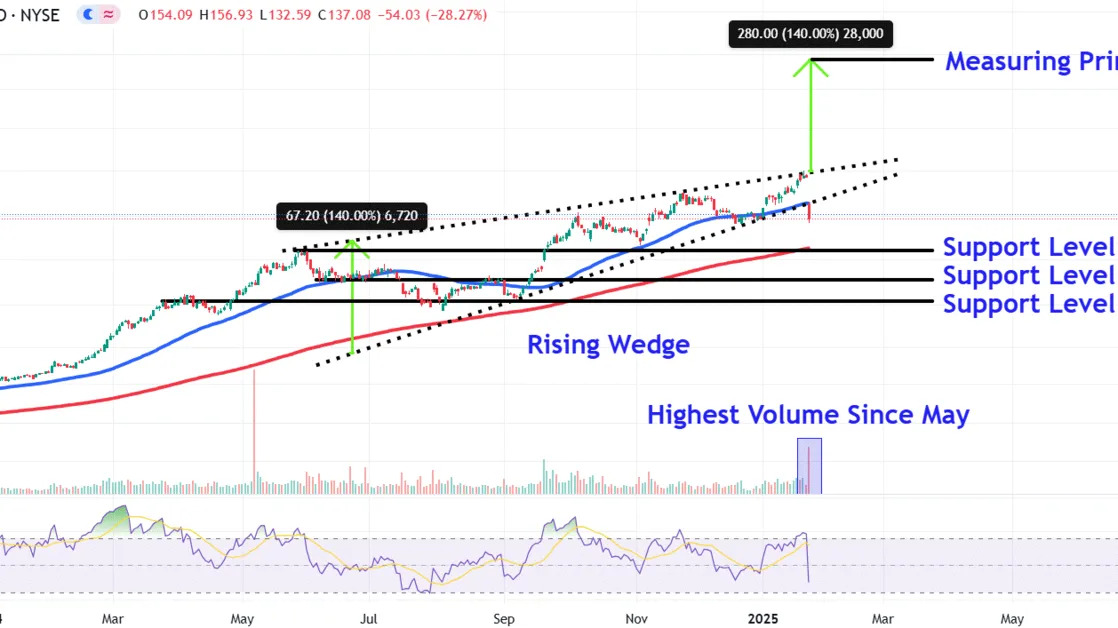
Shares of the nuclear power company, which more than tripled last year to post the second-biggest gain in the S&P 500, were off to another good start in 2025 amid the optimism about AI-related demand. The stock gave back all its early-year gains today, falling 28% to around $137.
Below, we break down the
technicals
on Vistra’s chart and identify crucial price levels that investors may be watching.
Rising Wedge Breakdown
Vistra shares have trended higher within an eight-month
rising wedge
, but staged a dramatic
breakdown
below the pattern’s lower trendline during Monday’s selloff in a move that could trigger short-term bearish sentiment.
Moreover, the stock registered its highest daily
trading volume
since early May, indicating selling conviction by larger market players, such as
institutional investors
and hedge funds.
Let’s turn to Vistra’s chart to identify
support levels
that could come into play amid further selling and also point out a potential bullish target if the stock resumes its longer-term uptrend and breaks above the rising wedge pattern.
Major Support Levels to Watch
The first major lower level to watch sits around $107, a location on the chart where the shares may encounter buying interest near the prominent May
peaks
and nearby upward sloping
200-day moving average
.
Selling below this level could see the shares decline to the $85 level. Investors may look for
entry points
in this area near a trendline that links a range of comparable price points on the chart between June and August.
Further
downside
opens the door for a retest of lower support around $72. The shares may attract buying interest in this region near a
horizontal line
that connects a series of highs and lows on the chart from late March to early September.
Bullish Price Target to Monitor
To project a bullish target above the rising wedge, investors can use the
measuring principle
, a technique that analyzes
chart patterns
to forecast how a future directional move might play out.
When applying the tool to Vistra’s chart, we calculate the percentage change between the rising wedge’s two trendlines and add it to the pattern’s upper trendline value. For example, we add 140% to $200, which projects a bullish target of $480, a location where investors who use technical analysis may look for
exit points
.
The comments, opinions, and analyses expressed on Investopedia are for informational purposes only. Read our
warranty and liability disclaimer
for more info.
As of the date this article was written, the author does not own any of the above securities.
Read the original article on
Investopedia
